|
Doppler imaging of stellar surface
Direct imaging or indirect mapping technics?
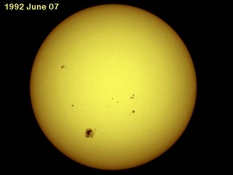
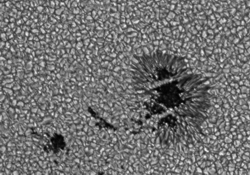
These days, with big ground-based telescopes, and space-borne satellites, the solar active regions can easily be studied in detail. A nice example is presented in the two figures below, where the solar photosphere is shown with a sunspot group on a larger scale.
However, with the exception of very few cases, stellar surfaces cannot be seen directly
even with today's most advanced telescopes.
Thus, when studying stellar activity one should apply different indirect techniques. The most recent mapping techniques (Doppler Imaging, Spectral Imaging, Zeeman-Doppler Imaging) are based on spectroscopic data. The simple idea of these kind of techniques is that the rotating star with inhomogeneous surface shows characteristic variability in the spectral line profiles, which can be collected and used to build up the temperature (or intensity, chemical abundance, magnetic field, etc.) distribution of the stellar surface.
Doppler imaging of stellar surface
The technics of Doppler Imaging uses the well-known Doppler-effect: the wavelength of the light would change if either the source or the observer was moving. If they were approaching, the wavelength would be shorter (blue-shift); if they were diverging, the wavelength would be longer (red-shift). (Originally, in 1842, Christian Doppler applied his theory to sound waves, but it works with all types of waves.)
 |
 |
 Now, for simplicity, let's take a rotating star, emitting the light homogeneously from each point of its surface. It is easy to understand, that, through the rotation, different surface regions (I-V) correspond to variously Doppler-shifted emission: for instance, the light coming from the approaching limb (I) is blue-shifted, while the opposite limb (V) emits red-shifted light. The integration of the emission over the surface, thus results in a smeared intensity distribution, that is called rotationally-broadened line profile. The above left-hand figure shows an illustration for rotational broadening.
At this point we suppose that there is a dark area on the star covering half of the surface element no. III. This spot will disturb the regular shape of the rotationally-broadened profile, because, there will be a deficient emission at a given wavelength (i.e., at a given amount of Doppler-shift), thus, the integration over the whole visible surface results in a disturbed line profile. The location of the disturbing "bump" on the line profile depends on a) the location of the spot on the stellar surface and, through the rotational phase, on b) the time of observation. This way, the "bump" indirectly informs us about the location of the spot on the stellar surface. If we have enough spectra (enough disturbed line profiles) covering the whole rotational period, we could try to build up the Doppler image of the star. This will be easy to understand taking a look at the above right-hand figure.
The right-hand animation shows the changing spectral line profile due to a dark spot on the surface of the rotating star.
|