ISBN 963 8361 18 2 HU ISSN 0324- 2234
CONTENTS Page Preface ....................................................................171 List of participants .......................................................172 1. V.L. KHOKHLOVA: Magnetic Ap Stars - Surface Inhomogeneities and .........173 Methods of Spectroscopical Analysis 2. J. MADEJ: Hbeta Line Variability in 73 Draconis .........................174 3. KOLEV and E. GEORGEVA: Preliminary Results of Spectrophotometric Study of the Si-variable Star Theta Aur (HD 40312) .................175 4. W. SCH÷NEICH: Ultraviolet Observations of Magnetic CP Stars: a Short Review .......................................................176 5. E. ZELWANOWA, W. SCH÷NEICH and C. JAMAR: Ultraviolet TD-1 Observa- tions of HD 170000 and Six Helium Variables ........................179 6. K. STEPIEN: HD 221568 ...................................................180 7. B. MUSIELOK: Model of phi Draconis ......................................181 8. D.Z. KOLEV: Problems of Estimating the Angle between the Rotational and the Magnetic Axes of Stars - Using the Ap Star Theta Aur (HD 40312) as an Example ...............................................182 9. L. OETKEN: Properties of the Bowen Phase-shift Compensator ..............183 10. M. MINAROVJECH, M. RIBANSKY, J. ZIZNOVSKY and J. ZVERKO: Direct Intensity Microphotometer ..........................................184 11. K.P. PANOV: First Observations of Magnetic Stars with the New Pho- toelectric Photometer of the National Astronomical Observatory .....185 12. V.I. BURNASHEV, N.S. POLOSUKHINA and V.P. MALANUSHENKO: Results of Narrow-band Photometry of the Magnetic Star 53 Cam .................187 13. L. HRIC and J. ZVERKO: Working Report on 8 Ap Stars ....................188 14. K. JUZA and J. ZVERKO: Photometry of AR Aur Eclipsing Ap Binary ........189 15. T. JARZEBOWSKI: Search for Short-period Variations in Ap Stars .........190 16. J. ZVERKO and K.P. PANOV: Search for Rapid Light Variability of HD 215441 ..........................................................192 17. S.I. PLACHINDA, A.B. SEVERNY and E.S. DMITRIENKO: gamma Cyg - Magnetic Periodic Star? .....................................................193 18. G. RÐDIGER: Stellar Activity and Dynamo Theory .........................194 19. J. SMAK: Dwarf Novae ...................................................195 20. G.A. RICHTER: Separation of WZ Sagittae Stars from Fast Novae by a Purely Photometric Criterion .......................................201 21. G. KOV¡CS: Photoelectric Observations and Preliminary Analysis of the Variable White Dwarf R808 ......................................202 22. L.V. MIRZOYAN: Physical Properties of Stellar Flares ...................204 23. M.K. TSVETKOV: Flare Star Search in the Period 1979- 1982 ..............206 24. K.P. PANOV, M. GRIGOROVA and A. TSINTSAROVA: High Flare Activity of the Flare Star AD Leo in 1982 ...................................208 Page 25. L. SZABADOS: Binary Stars among the Physical Variables .................209 26. S. R÷SSIGER: V 1068 Cygni - a Long Period RS CVn Star? .................217 27. L. PATK”S: Spot Activity of the Close Binary SV Cam ....................218 28. H.A. MAHDY and M.A. SOLIMAN: Photoelectric Minima of VW Cephei and V 566 Ophiuchi .....................................................219 29. M. POPOVA, A. ANTOV and V. POPOV: Observations of a New Minimum in Optical Radiation of X-ray Source KR Aurigae .......................220 30. M. JERZYKIEWICZ, R.H. SCHULT and W. WENZEL: AQ Leonis Updated ..........222 31. K. BARLAI: An Interesting Variable in M15 ..............................223 32. M. MARIK: Model of Fluctuation of Period in Multiple Periodic Variables 225 33. A. OPOLSKI: Pulsation Modes and Photometric Masses of Cepheid Variables 227 34. B. VET’: Standstill of Some delta Scuti Stars ..........................249
PREFACE The 5th conference of Subcommission No. 4, "Magnetic Stars'', and the 4th conference of Subcommission No. 3, "Nonstationary Stars'', of the multilateral cooperation "Stellar Physics and Evolution" was held as a joint symposium "Magnetic and Variable Stars" in Szombathely, Hungary, between 30 May and 3 June 1982. The symposium was organized by the Konkoly Observatory of the Hungarian Academy of Sciences, the Department of Astronomy of Eˆtvˆs Lor·nd University and the Eˆtvˆs Lor·nd Physical Society. Fifty-four astronomers of seven countries participated in the symposium where 8 review papers and 31 contributed papers were read. The abstract or a short version of most of the papers presented is published in the present proceedings. The editors wish to express their sincere appreciation to all who contributed to the success of the symposium. The financial support provided by the Hungarian Academy of Sciences and Eˆtvˆs Lor·nd University is gratefully acknowledged. The Editors Budapest-Szabads·ghegy, 31 October 1982 Scientific Organizing Committee: Co-chairmen: W. Schˆneich and S. KanyÛ; Secretary: L. Szabados Members: V.L. Khokhlova, F. Krause, M. Marik, L.V. Mirzoyan, K.P. Panov, J. Smak, K. Stepien, B. Szeidl and W. Wenzel Local Organizing Committee: Chairman: M. Marik; Secretary: E. VÈrtes Members: E. Rupp, L. Szabados, B. Szeidl, G. TÛth, M. Varga and I. Vincze
LIST OF PARTICIPANTS Bulgaria Poland Hungary Kolev, D.Z. Gertner, J. Barcza, S. Kovatchev, B. Jarzebowski, T. Barlai, K. Panov, K.P. Madej, J. Grandpierre, A. Popova, M.D. Muciek, M. Gyˆrgyey, J. Opolski, A. KanyÛ, S. Czechoslovakia Smak, J. Kov·cs, G. Stepien, K. Kun, M. Hric, L. Woszczyk, A. L·ng, K. Juza, K. Zaremba, D. Marik, M. Mikulasek, Z. Ol·h, K. Ziznovsky, J. U.S.S.R. Pap, J. Zverko, J. PaparÛ, M. Dolginov, A.Z. PatkÛs, L. Egypt Glagolevsky, Yu.V. Rupp, E. Soliman, M.A. Khokhlova, V.L. Szabados, L. Mirzoyan, L.V. Szeidl, B. G.D.R. Plachinda, S.I. TÛth, G. Oetken, L. Vargha, M. Radler, K.-H. VÈrtes , E. Richter, G. Vetı, B Rˆssiger, S. Vincze, I. R¸diger, G. Vir·ghalmy, G Schˆneich, W. Zombori, O. Schult, R.
MAGNETIC Ap STARS - SURFACE CHEMICAL INHOMOGENEITIES AND METHODS OF SPECTROSCOPICAL ANALYSIS V.L. Khokhlova Astronomical Council of the U.S.S.R. Academy of Sciences Pyatnitskaya 48, Moscow, SU-109017 Consideration was given to the difficulties arising when magnetic Ap stars with chemically inhomogeneous surfaces are analysed by traditional methods using the empirical or theoretical curve of growth. The result of abundance determination by the equivalent width of lines of an integrated spectrum depends on line intensity, and the determination of turbulent velocity leads to underestimation of this parameter. The discrepancies in abundance determinations made by the coincident statistics method (CSM) of Aikman and Cowley and by the theoretical curve of growth method are explained and it is pointed out that the CSM method seems to give more reliable results. The necessity for determining local (coordinate-dependent) characteristics instead of integral characteristics (such as W or He) is pointed out. The result is shown of the mapping of some chemical elements over the surface of magnetic stars epsilon UMa, CU Vir, alpha^2 CVn, chi Ser and compared with the position of magnetic poles.
H_beta LINE VARIABILITY IN 73 DRACONIS J. Madej Warsaw University Observatory Warsaw, Poland A new photoelectric method for measurements of periodic Balmer line variations in magnetic Ap stars is proposed and tested in the case of the H_beta line in 73 Dra. The instrumentation consists of a standard one-channel photoelectric photometer and three double half wave (D.H.W.) interference filters of different half-widths, centred at Hbeta. In this investigation the halfwidths of the narrow, mean and wide filters are 30 A, 75 A and 144 A, respectively. Variations of the index beta_3 = 2.5 log(F_w/F_m), where F_w and F_m are the corresponding measured fluxes, represent the direct measure of the total H_beta equivalent width (W_lambda) variations (in per cent) as both filters are sufficiently wide to cover the total W_lambda(H_beta) in Ap stars of any (T_eff , log g) values. The Crawford index beta = 2.5 log(F_w/F_m) variations give additional independent information on the character of the W_lambda(H_beta) phase curve. This method applied to 73 Dra shows that this Ap star exhibits periodic variability of the H_beta line in the form of a single wave, and amplitude DeltaW_lambda/W_lambda(max) = 7% . Moreover, the extremal values of W_lambda(H_beta) coincide in phase with extremal H_eff(phi) values. Comparison with earlier spectroscopic observations shows that variable metallic lines near H_beta give rise to the beta_3 variations of an order of magnitude less than H_beta itself. This result should be considered as verification of earlier photographic observations of H_gamma and higher Balmer lines in 73 Dra, which previously gave particularly inconsistent results. Comparison with measurements of standard stars shows that this method enables one to measure DeltaW_lambda variations with an error of only 2-3 %, which is superior to 10% (or larger) and the sometimes subjective errors of W_lambda measured on photographic spectrograms. Moreover, its high efficiency allows for future statistical investigation of Balmer line variations in Ap stars in a particularly homogeneous way.
PRELIMINARY RESULTS OF SPECTROPHOTOMETRIC STUDY OF THE Si-VARIABLE STAR theta Aur (HD 40312) D. Kolev and E. Georgeva Bulgarian Academy of Sciences, Section of Astronomy and National Astronomical Observatory, Sofia, ul. 7 Noemvri 1. Spectrophotometric study of the Ap star Theta Aur is carried out on 9 A/mm and 4 A/mm spectrograms. The variations of the equivalent widths of the SiII multiplets (1) and (3) are investigated for periods 1.3717d, 1.3735d and 3.618d. The intensity of the lines varies more than twice. The best agreement between observations in the years 1981 and 1982 is achieved for P = 1.3717d. The following parameters were found according to the average H_gamma profile of Theta Aur: T_e= 11500 K, log g= 3.85, Sp= B9Vp . The radius and the mass of the star are estimated as follows: R = 2.5R_sun and M = 3.5M_sun. The projected rotational velocity is v sin i = 53.5 +- 1.0 km/s and the inclination angle has a value of 35 degree for the period 1.3717d.
ULTRAVIOLET OBSERVATIONS OF MAGNETIC CP STARS: A SHORT REVIEW W. Schˆneich Zentralinstitut fur Astrophysik Potsdam, Telegrafenberg, DDR Ultraviolet observations have proved to be very important for investigating magnetic stars. After the detailed review on Ap stars (Leckrone, 1975) new results have become available and it is now usual to discuss magnetic CP stars; these include the Helium variables in addition to the Ap stars. Ultraviolet observations of magnetic CP stars have been carried out with OAO-2, COPERNICUS, TD-1A, ANS and IUE. Photometric observations by Bernacca and Molnar (1972), Leckrone (1973), van Dijk et al. (1978) and Jamar et al. (1978) show that the relation between Balmer and Paschen continua for silicon stars is significantly different from that of normal stars, whereas for He-w stars and to some extent for Cr-Eu-Sr stars the disagreement is not so pronounced. Time resolved photometric observations were made for a number of magnetic CP stars. In Table I those stars are collected for which light curves have been published. Table I star experiment reference HD 15089 OAO-2 Molnar et al. (1976) HD 112185 OAO-2 Molnar (1975) HD 112413 OAO-2 Molnar (1973) HD 124224 ANS Molnar, Wu (1978) HD 125823 OAO-2 Molnar (1974) HD 140728 ANS van Dijk et al. (1978) HD 170000 TD-1A Jamar (1977) HD 215441 OAO-2 Leckrone (1974) In the case of 21 other stars, variability on ultraviolet was noted (Table II). Table II reference stars Leckrone (1975) HD 215038, 56 Ari, Chi Ser van Dijk et al. (1978) HD 22478, HD 25267, HD 32650, HD 56022, HD 118022, HD 122532, HD 125248, HD 133660, HD 151529, HD 173650, HD 193722, HD 196176, HD 196502, HD 203006 Jamar (1977, 1978) 56 Ari, HD 27309, HD 40312, HD 124224, HD 177410 For some other stars with known periods TD-1A observations made at different times are available. They are being investigated by Zelwanowa, Schˆneich and Jamar. Preliminary results on Helium variables will be presented at this meeting (see the next paper on page 179). The main results from UV light curves are: - The UV light curves generally show the same character as those in the visible and can also be explained as rotational variability. - The spots, bright in the visible, become dark in the UV. The dependence of the "null wavelength" on stellar temperature, suggested by Molnar et al. (1976), is doubtful as was noted by Jamar (1977). - The large amplitudes in UV (cca. 0.5 mag in some cases) indicate that the dark spots should be very large (Jamar, 1978). The amplitude of 1.2 mag found by Leckrone (1975) at 1100 A for alpha^2 CVn demands a minimum spot radius of 0.8 stellar radius. Such large radii are not in agreement with the shapes of the light curves. This can be explained if the limb darkening is very strong at this wavelength. - The hotter Helium variable a Cen does not show a "null wavelength" in the observed spectral region (>1450 A). This fact can give the key to the problem of the mechanism of light variability of magnetic CP stars. Spectral observations of magnetic CP stars with high resolution in the ultraviolet were carried out with COPERNICUS and IUE. The results published till now are mainly of a qualitative character. Line identifications and the discovery of line variations are important especially for 4 He rich stars (HD 37017, sigma Ori E, HD 37776, HD 64740). In these stars, the silicon lines vary in antiphase to the He lines, as in He weak and hot Ap stars, although the results of analysis (Hunger, 1975), that the He-r stars do not show silicon overabundances, has not been corrected till now. In Table III high resolution UV observations of magnetic CP stars are collected. Table III reference stars Barylak, Rakos (1981) HD 219749 Castelli et al. (1981) 78 Vir Fahey (1980) HD 125823 Hunger, Heber (1981) CPD-46 3093 Leckrone (1980) 21 Per Leckrone, Snijders (1979) alpha^2 CVn Lester (1979) HD 64740 Mallama, Molnar (1977) epsilon UMa Rakos (1980) HD 133029, HD 175362, HD 219749 Shore, Adelman (1981) HD 37017, sigma Ori E, HD 37776 Some papers, presented at the 2nd European IUE Conference, are not included because they were not available. References: Barylak, M., Rakos, K.D. 1981, In: Upper Main Sequence CP Stars, 23rd Liege Coll., p. 141. Bernacca, P.L., Molnar, M.R. 1972, Ap.J., 178, 189. Castelli, F., Faraggiana, R., Catalano, F.A., Maitzen, H.M. 1981, In: Upper Main Sequence CP Stars, 23rd Liege Coll., p. 135. Fahey, R.P. 1980, NASA Conf. Publ. 2171, p. 177. Hunger, K. 1975, In: Problems in Stellar Atmospheres and Envelopes, Ed.: Baschek, Kegel, Traving; Springer, Berlin, p. 57. Hunger, K., Heber, U. 1981, Astron. Astrophys., 101, 269. Jamar, C. 1977, Astron. Astrophys., 56, 413. Jamar, C. 1978, Astron. Astrophys., 70, 379. Jamar, C., Macau-Hercot, D., Praderie, F. 1978, Astron. Astrophys., 63, 155. Lester, J.B. 1979, Ap.J., 233, 644. Leckrone, D.S. 1973, Ap.J., 185, 577. Leckrone, D.S. 1974, Ap.J., 190, 319. Leckrone, D.S. 1975, IAU Coll. No. 32, Vienna, p. 465. Leckrone, D.S. 1980, Highlights of Astronomy, 5, 277. Leckrone, D.S., Snijders, M.A.J. 1979, Ap.J. Suppl., 39, 549. Mallama, A.D., Molnar, M.R. 1977, Ap.J. Suppl., 33, 1 Molnar, M.R. 1973, Ap.J., 179, 527. Molnar, M.R. 1974, Ap.J., 17, 531. Molnar, M.R. 1975, Astron. J., 80, 137. Molnar, M.R., Mallama, A.D., Holm, A.V., Soskey, D.G. 1976, Ap. J., 209, 146. Molnar, M.R., Wu, C.-C. 1978, Astron. Astrophys., 63, 335. Rakos, K.D. 1980, NASA Conf. Publ. 2171, p. 167. Shore, S.N., Adelman, S.J. 1981, In: Upper Main Sequence CP Stars, 23rd Liege Coll. p. 429. van Dijk, W., Kerssies, A., Hammerschlag-Hensberge, G., Wesselius, P.R. 1978, Astron. Astrophys., 66, 187.
ULTRAVIOLET TD-1 OBSERVATIONS OF HD 170000 AND SIX HELIUM VARIABLES (PRELIMINARY RESULTS) E. Zelwanowa and W. Schˆneich Zentralinstitut f¸r Astrophysik, Potsdam, DDR and C. Jamar Institut d'Astrophysique, Liege, Belgique Observations are presented on the first seven magnetic CP stars with known periods and more than one available TD-1 (S2/68) observation. The shape of the light curves of the silicon star HD 170000 (65 observations) varies strongly with the wavelength. There is evidence of two dark spots at phases 0.1 and 0.7 (light maximum in the visible is at phase 0.0). The second spot coincides with the positive magnetic pole. The He-weak star HD 28843 (B9 IV Si) varies at lambda 1440 in antiphase to lambda 2740 and to the visible spectral region. Similar behaviour but with smaller amplitude was found for HD 125823 and HD 175362. For the He-rich star HD 64740 no significant variation was found. For the stars HD 49333 (He-w) and HD 58260 (He-r) the periods are known only with low accuracy. It is impossible to derive the phases of the observations and therefore to derive conclusions on variability. Details are being prepared for publication.
HD 221568 K. Stepien Warsaw University Observatory, Al. Ujazdowskie 4, Warsaw, Poland A grid of model atmospheres with chemical compositions characteristic of the red and blue phases of HD 221568 was obtained by Dr. Mutham of Vienna Observatory. Theoretical energy distributions were fitted to spectrophotometric observations obtained by Kodaira, supplemented by UV observations obtained with the International Ultraviolet Explorer. A comparison of theoretical models at the same temperature but chemical abundances characteristic of blue and red phases shows that the differences due to a different chemical composition are very small which means that the large light variations observed for this star cannot be explained solely by the effect of differential blanketing. However, fits to observations show that the star has the same temperature (10300 ± 100 K) in both phases. It is suggested that the observed light variations can be explained by a difference in the effective radii of the star in both phases if the star is non-spherical. However, to explain the decrease of flux around band B of the UBV system in the red phase it seems to be necessary to assume that a part of the energy at the photospheric level occurs in a non-radiative way. The different possibilities of such a mode of transport are discussed.
MODEL OF phi DRACONIS B. Musielok Astronomical Institute of Wroclaw University, Wroclaw, Poland A model of the surface brightness distribution was calculated for the Ap star phi Dra. The model is based on 49 photoelectric measurements in the Y band of the 10-colour system with some additional information taken from the ultraviolet photometry of Jamar (1977), the magnetic field measurements of Landstreet (1977) and spectroscopic measurements of the author. These data suggest that there are two spots on the surface of the star. The following parameters were determined: positions of the spots, their dimensions, contrasts to the remaining atmosphere and inclination of the rotational axis to the line of sight. Three of these parameters were compared with other measurements or theoretical presumptions.
PROBLEMS OF ESTIMATING THE ANGLE BETWEEN THE ROTATIONAL AND THE MAGNETIC AXES OF STARS - USING THE Ap STAR Theta Aur (HD 40312) AS AN EXAMPLE D.Z. Kolev Bulgarian Academy of Sciences, Section of Astronomy and National Astronomical Observatory, Sofia, ul. 7 Noemvri 1, Bulgaria Uncertainties in determining the obliquity (beta) between the rotational axis of stars and the magnetic-dipole one are discussed. The Si-variable Ap star Theta Aur is used as an example. Spectral observations of the variation in the Si II lines confirm the period 1.3717d ; the magnetic measurements (1) give P = 3.618d. The radius of the star is estimated to be R = 2.5R_sun and our measurements give v*sin i = 53.5 km/sec. New values for the parameters of the magnetic-dipole model for Theta Aur are obtained using our data and measurements of the field from Borra and Landstreet (1). Namely, our measurements are: inclination angle i = 350 degrees, beta = 82 degrees and the polar field B_p = 1670 G; in contrast to the values in (1), viz. i = 77 degrees, beta = 51 degrees and B_p = 1300 G. The general conclusion is that Theta Aur is a rapid magnetic rotator with high obliquity. Reference: (1) Borra, E.F., Landstreet, J.D. 1980, Ap.J.Suppl., 42, 421.
PROPERTIES OF THE BOWEN PHASE-SHIFT COMPENSATOR L. Oetken Zentralinstitut f¸r Astrophysik, Potsdam, Telegrafenberg, DDR An observed unexpected stellar polarity reversal led to the re-discussion of instrumental phase shifts between rectangular light components, especially those introduced by the phase shift compensator constructed after a proposal of I.S. Bowen. Since this discussion may be of interest to other observers, the main results are summarized here. If such a compensator-device is made of two eighth-wave-retardation plates thus leading to a maximum phase shift of pi/2 the direction of circulation of the light passing the compensator cannot be changed. Therefore no polarity reversal can be produced in all cases for which the telescope introduces effective phase shifts (retardances) smaller than pi/2 . However, if the instrument produces effective phase shifts larger than pi/2 - under discussion for the 2 m Universal telescope at Tautenburg for stars near the pole - such an eighth-wave-plate compensator can produce circularly polarized light only without restoring the direction of circulation of the star light that may be misinterpreted as polarity reversal. If, on the other hand, the compensator is made of thicker retardation plates so that phase shifts larger than pi/2 can be introduced by it, both possibilities exist, this means that the conservation of the direction of circulation as well as its change can generally be reached. Therefore, besides the usual calibration consisting of the reproduction of circular polarized light using an artificial circular polarized light source in the telescope tube, an additional test is necessary to decide what has happened.
DIRECT INTENSITY MICROPHOTOMETER M. Minarovjech, M. Ribansky, J. Ziznovsky, J. Zverko Astronomical Institute, Slovak Academy of Sciences Tatransk· Lomnica, Czechoslovakia A device for direct intensity recording of photographically recorded spectra is described. The principle of the device is based on an unusual expression of the characteristic curve enabling it to be approximated by a straight line through the whole range of optical densities usually used in photographic photometry. A special-purpose analog computer was then constructed utilizing modern elements. Examples of use as well as an estimate of errors are given.
FIRST OBSERVATIONS OF MAGNETIC STARS WITH THE NEW PHOTOELECTRIC PHOTOMETER OF THE NATIONAL ASTRONOMICAL OBSERVATORY K.P. Panov Department of Astronomy with National Astronomical Observatory, Bulgarian Academy of Sciences 7 November str. 1, Sofia, Bulgaria A new one-channel UBV photoelectric photometer was designed and built in the Department of Astronomy, Bulgarian Academy of Sciences, for the 60 cm telescope of the National Astronomical Observatory. Photon-counting mode is used. Details of the equipment are presented in another paper (Panov et al., 1982). A programme of photoelectric observations of magnetic stars was started in 1981 with the 60 cm telescope of the National Astronomical Observatory in order to search for short-term light variations in these stars. Many reports have been published so far on this subject (e.g. Schˆneich, 1978), but the problem is still unresolved. Preliminary results were obtained for the stars HD 219749 (B9p) and 53 Cam (A2p). Most of the observations were carried out with an integration of 1 sec in all UBV colours quasi-simultaneously. File observations of HD 219749 were obtained on 5 nights in September - October 1981. Short-term variation with a cycle of about 150 min is clearly seen in the run of 19/20.09.1981 in all UBV colours. The amplitudes are 0.01 mag in V, 0.01 mag in B and 0.02 mag in U. These short-term variations are also present in the runs of 20/21.09.1981 and 30/31.10.1981. Earlier results of Panov (1978) and Hildebrandt (1981) are thus confirmed by these new observations. It is not yet clear whether the short-term light variation of HD 219749 is related to the rotational period. Rapid variability in the spectrum of 53 Cam was reported by Polosukhina et al. (1981) and by Kuvshinov and Plachinda (1980). File observations in UBV of the magnetic star 53 Cam were obtained during 3 nights of January 1982. The runs evaluated so far show complicated short-term variations. An increase of brightness is seen in the run of 21/22.01. 1982 in all UBV colours: 0.01 mag in 1.5 hours. The observations of 27/28.01.1982 show short term variations with rather different characteristics: quasi-periodic variation with a cycle of about 70 min and amplitude 0.008 mag is present in V. During the same time irregular light variations with a decreasing amplitude are seen in B. The cycle length varies from 40 to 25 min. This is an indication that the short-term light variations of 53 Cam might have a complicated character. References: Hildebrandt, G. 1981, Commun. Special Astrophys. Obs., No. 32, 74. Kuvshinov, V.M., Plachinda, S.I. 1980, Pisma v Astr. Zhu., 6, 368. Panov, K.P. 1978, Publ. Astron. Inst. Czechosl. Acad. Sci., No. 54, 19. Panov, K.P., Pamukchiev, I.Ch., Christov, P.P., Petkov, D.I., Notev, P.T., Kotsev, N.G. 1982, Comptes Rendus of the Bulgarian Acad. Sci. (in press). Polosukhina, N.S., Chuvaev, K.K., Malanushenko, V.P., Tuominen, I., Kholsti, 1981, Commun. Special Astrophys. Obs., No. 32, 68. Schˆneich, W. 1978, Publ. Astron. Inst. Czechosl. Acad. Sci., No. 54, 16.
RESULTS OF NARROW-BAND PHOTOMETRY OF THE MAGNETIC STAR 53 Cam V.I. Burnashev, N.S. Polosukhina, V.P. Malanushenko Special Astrophysical Observatory, Zelenchuk, U.S.S.R. During 16 nights between 20.02.80 and 15.03.81 using an SF-68 spectrophotometer, flux measurements of the magnetic star HD 65339 (53 Cam) were taken related to the comparison star HD 65301 in the spectral band Delta lambda = 30 A, centred at lambda = 4187 A. The dispersion of measurements of relative fluxes Delta m_i = m_53 Cam - m_comp for individual nights significantly exceeded the error of measurements and was ascribed to the real variations of 53 Cam flux for one night. Our studies of the behaviour of this variation permitted us to draw the following conclusions: 1. There are periodic variations of complex character that may be described by a sum of three simple sinusoidal curves with the periods P_1 = 20.14m ± 0.0001, P_2,= 27.5828m ± 0.0001 and P_3= 79.2381m ± 0.0001 , present during 1.5 year. 2. The amplitudes of variations change with the rotational phase of the star. 3. The exception to the typical behaviour stated above was the night of 15-16.12.1980 when the observed variations Delta m can be described with the single period P_1 = 47.02m. 4. On the basis of mean values of Delta m the variation of the relative flux of radiation with the period of star rotation (P= 8.0267d) was shown. These variations correlate well with the variations of the effective magnetic field of the star.
WORKING REPORT ON 8 Ap STARS L. Hric and J. Zverko Astronomical Institute of the Slovak Academy of Sciences Tatransk· Lomnica, Czechoslovakia Eight doubtfully classified Ap stars were selected for detailed spectroscopic and photometric study. Locations in two-colour diagrams were found. All the stars studied are near the main sequence. Projected rotational velocities were determined from the Mg II 448.1 nm line. Remarkable differences of T_eff values derived from the UBV, uvbybeta, Hbeta,gamma,delta lines were found.
PHOTOMETRY OF AR Aur ECLIPSING Ap BINARY K. Juza and J. Zverko Astronomical Institute of the Slovak Academy of Sciences Tatransk· Lomnica, Czechoslovakia The minima of a detached eclipsing system AR Aur were observed photoelectrically by a 0.6 m telescope at SkalnatÈ Pleso Observatory. Our data confirm that the orbital period is decreasing at the present time. The minima light curve shapes indicate possible total eclipses.
SEARCH FOR SHORT-PERIOD VARIATIONS IN Ap STARS
T. Jarzebowski
Wroclaw University Observatory
Kopernika 11, Wroclaw, Poland
Photoelectric observations of four peculiar stars - 21 Com, HD 71866, HD 224801 and
HD 32633 - were made at San Pedro Martir Observatory (Baja California, Mexico).
21 Com was investigated on six nights. The observations do not confirm the 32 min
period reported by Bahner and Mavridis and by Percy.
HD 71866 was investigated on three nights. The results do not exclude the
possibility of some variations, but we did not find the 97 min oscillations quoted by
Rakos.
The observations of HD 224801 and HD 32633 are shown in the figures (points and
crosses refer to different comparison stars). Some light variations are possible, this can
especially be seen in the case of HD 32633. The results do not confirm, however, the
periods of 124 min and 106 min, reported by Rakos for HD 224801 and HD 32633, respectively.
 Figure 1
 Figure 2
Taking into account all present observational data we see that short-period
luminosity variations are definitely established only in two peculiar stars (investigated
by Kurtz), viz. HD 24712 and HD 101065 . If, however, these variations were not associated
with pulsation, one could conclude that there are no delta Scuti-type variables among peculiar
stars.
Figure 2
Taking into account all present observational data we see that short-period
luminosity variations are definitely established only in two peculiar stars (investigated
by Kurtz), viz. HD 24712 and HD 101065 . If, however, these variations were not associated
with pulsation, one could conclude that there are no delta Scuti-type variables among peculiar
stars.
SEARCH FOR RAPID LIGHT VARIABILITY OF HD 215441 J. Zverko Astronomical Institute of the Slovak Academy of Sciences Tatransk· Lomnica, Czechoslovakia and K.P. Panov Department of Astronomy with National Astronomical Observatory Bulgarian Academy of Sciences, Sofia, Bulgaria Photoelectric UBV and intermediate band observations were analysed for rapid light variability. The UBV observations were performed at the Bulgarian Academy of Sciences' Observatory, Rozhen, by a photoelectric photon counting photometer attached to a 0.6 m reflector. The observations were made with 1 or 10 sec integration time. The intermediate band observations were carried out at the Slovak Academy of Sciences' Observatory, SkalnatÈ Pleso, by a photometer arranged in a classic way equipped with a strip chart recorder. The filter used had a wavelength of lambda = 526 nm and a HW = 19 nm. In both cases HD 215501 was the comparison star. The observations of the magnetic star were reduced in the usual way relative to the comparison. Moreover, the observations of the comparison were expressed in magnitudes. Thus two light curves were obtained, one for the magnetic star, the other for the comparison. The curves were always found to be similar to each other and variations on them strongly correlated to observation conditions. Scattering extends to 0.01 mag in the best conditions and this is so for the variable and the comparison as well. This is valid for both the UBV and intermediate band photometry. It is impossible to decide without a data frequency analysis whether there is an intrinsic rapid variability of less than 0.01 mag hidden in the HD 215441 light curve. The rotational light curve was studied and an ephemeris JD(max. light)= 2436865.0 + 9.4875d*E was derived.
gamma Cyg - MAGNETIC PERIODIC STAR? S.I. Plachinda, A.B. Severny, E.S. Dmitrienko Crimean Astrophysical Observatory Nauchny, Crimea, SU - 334413 The effective longitudinal magnetic fields of the supergiant gamma Cyg were measured in 1977 and 1981 utilizing the photoelectric scanner-magnetometer of the Crimean Observatory's 2.6 m reflecting telescope. The star beta CrB with the known variable magnetic field was used as a comparison star. We found good agreement of our observations of beta CrB with the observations of other authors. The periodic variations, 8.2594d, of longitudinal magnetic field strength in the limits -40 gauss to +40 gauss were suspected for gamma Cyg.
STELLAR ACTIVITY AND DYNAMO THEORY G. R¸diger Zentralinstitut f¸r Astrophysik Potsdam, Telegrafenberg, DDR Skylab and EINSTEIN experiments revealed that (i) the solar corona is extremely inhomogeneous and (ii) stellar coronae exist along the whole main sequence. Both findings are incompatible with the standard theory of acoustic heating of a corona. There is little doubt that only magnetism is able to provide the observed large scale ("loop") structures and to ensure the frequent occurrence of stellar coronae. A new tool for the development of the dynamo theory has thus been provided. The observations seem to confirm the newly established suggestion according to which the stellar activity may not decrease towards the lower end of the main sequence. Wilson found stars with cyclic chromospheric activity down to spectral type K5 and with periods of about 10 years. At least for G and K dwarfs the activity is thus due to a solar-like dynamo mechanism. In accordance with the dynamo theory the current observations have so far revealed no dependence of the cycle period on the spectral type. It has further been proved that (i) cyclic stars are weak emitters and (ii) weak emitters are old stars - so that the cyclic dynamo stars should be rather old. The strong and the weak emitters are separated by a distinct gap which, however, disappears for stars later than (say) K3. In the latter region the weak emitters are missing rather than the old stars. We suggest that the rotation rate (t_rot) in its relation to the turnover time (t_cor) (taken in the bulk of the convection zone) determines the stellar magnetohydrodynamics: only slow rotators (t_rot > t_cor) can function as a cyclic dynamo. Since the turnover time of an M0 star is rather long (200 days), slow rotators of this type either do not yet exist or are very rare. This may be the reason for the non-existence of the Vaughan-Preston gap for the latest dwarfs. Recent spectacular measurements of rotational periods via daily variations of H and K emission led to the conclusions that (i) all young stars possess one and the same period (about 7 days); (ii) the rotation rate increases with decreasing emission, i.e. with increasing age; (iii) among the stars with 40 days the K2 stars are cyclic and the K7 stars are eruptive. The key question is whether the last feature indicates the existence of a critical angular velocity which separates the cyclic and the non-cyclic emitters.
DWARF NOVAE
J. Smak
Copernicus Astronomical Center
Polish Academy of Sciences
Warsaw, Poland
During the last year major progress has been made in our understanding of the
nature of dwarf novae and - in particular - of the mechanism responsible for the unstable
character of accretion in those objects. In this paper I am not going to review the general
field of cataclysmic binaries nor the previously existing accretion theories partly
applicable to these objects: excellent reviews of this type can be found in the literature
(cf. Robinson 1976, Pringle 1981). Instead I intend to concentrate on the most recent
theoretical results concerning accretion in dwarf novae.
In the theory of thin, Keplerian accretion disks it is possible to treat separately
the problem of radial structure (i.e. of radial flow or accretion) and the problem of
vertical structure. Until very recently most authors concentrated on radial structure,
bypassing the problem of the vertical structure through a crude averaging procedure. The
new developments come from a detailed consideration of the vertical structure.
Let us consider the vertical structure at a distance r from the central mass M.
After assembling all relevant equations for the vertical structure (basically of the same
type as for the stellar interiors) one can see that one of the parameters involved must be
independent, while all the others - after performing the integration in z - can be
expressed as its functions. By analogy with stellar interiors (and the Vogt- Russell
theorem) we can choose for this independent parameter the surface density Sigma (i.e. the mass
accumulated over 1 cm - of the equatorial plane). Since the accretion is responsible for
the "energy generation" we can alternatively consider as the free parameter the local
accretion rate M^dot which - via simple proportionality - determines the local emerging flux or
effective surface temperature: F = sigma*T_e^4 . Two parameters are crucial for the
vertical structure: the temperature gradient nabla (as in stellar interiors) which depends on
the mechanism of the energy transport in the vertical direction, and the coefficient of
viscosity nu (per gram); note that viscosity is responsible for the outward flow of the
angular momentum necessary for the inward flow of mass (i.e. for the accretion) and hence
for the local "energy generation" (more precisely for the dissipation of the mechanical
energy). In the classical theory of alpha-disks (cf. Pringle 1981) the vertical structure
is simply averaged under the assumption of radiative equilibrium (i.e. Nabla = Nabla_r). In
addition, since the nature of viscosity remains unknown, one introduces an arbitrary, free
parameter a defined by the relation: nu = alpha*v_s*z_0, where v_s is the velocity of sound
and z_0 is the thickness of the disk.
In the recent models of the vertical structure (Canizzo et al. 1982, Meyer and
Meyer-Hofmeister 1981, Smak 1982a,c) the possibility of the convective transport of energy
is explicitly included and the temperature gradient is calculated as
Nabla = min(Nabla_r,Nabla_c), again in full analogy with stellar interiors. With respect
to alpha the three groups of papers differ significantly: the Meyers have used - essentially -
the alpha-disk approach, i.e. have described viscosity via a single, free parameter alpha.
Canizzo et al. use a lower value of alpha for the radiative regions and a higher value of a for
the convective regions. In my models I assume that convection is the only source of
turbulence responsible for viscosity and hence I put alpha = 0 in the radiative regions; in
the convective regions it is possible - in principle - to relate alpha to other convective
parameters; however, since the mixing-length theory fails near z = 0, I have so far been
unable to eliminate alpha in this way and it - essentially - remains a free parameter for the
convective regions. These three different types of approach simply reflect our ignorance
with respect to the true nature of viscosity. Very fortunately it turns out that most basic
conclusions are - qualitatively - nearly the same. In what follows I will refer mostly to
my own results but I wish to emphasize that the basic explanation of the nature of
instability in the outer parts of disk in dwarf novae was first given by Meyer and
Meyer-Hofmeister (1981).
Figure 1 shows the crucial T_e - Sigma relation resulting from the integration of
the vertical structure. Although such a specific relation is obtained for a given distance
r from the central star and with a specific value of alpha, it turns out that the shape of
this relation is nearly universal. In particular, by going to other distances, or by
changing alpha, we produce a shift only in the log Sigma coordinate, while the critical
points in log T_e (to be discussed below) remain almost unaffected. There is a simple
explanation for the shape of this basic relation: the two "bends" BCD and DEF are related
to the considerable decrease in the adiabatic gradient due to - respectively - partial
ionization of hydrogen and formation of the molecular hydrogen. The crucial
 Figure 1 Schematic representation of the log T -log Sigma diagram. The log T
values for points B, D, F marked on the left margin are only approximate and
depend on the details of the vertical structure.
point is that branches BC and DE are unstable against perturbations in Sigma (Meyer and
Meyer-Hofmeister 1981, Smak 1982a); they are also unstable against thermal perturbations
(Smak 1982c).
In the case of stationary accretion we have
F = sigma*T_e^4 = 3M^dot GM/8*pi*r^3
which shows that the lowest temperature will be at the outer edge of the disk and its value
will be determined by the product M^dot/r^3. Critical analysis of the observational data
(Smak 1982b) shows that in the case of novae and nova-like objects, i.e. in the case of
disks with presumably stationary accretion, the temperatures of their outermost parts are
higher than log T_e = 3.8 (corresponding to the critical point B in Fig.1). In the case of
dwarf novae, however, primarily due to lower accretion rates, the temperatures of the
outermost parts of their disks would - under stationary conditions - be below the critical
value. Hence in this case we must expect instabilities.
So far I have discussed models in thermal equilibrium. Let us now consider possible
deviations from the thermal equilibrium, i.e. models which include cooling or heating of
the disk. Crude calculations show (Smak 1982c) that models with cooling are located to the
left, while models with heating - to the right of the "standard" curve in the T_e - Sigma
diagram. Suppose a local structure of the disk is represented by a point somewhere on the
AB branch and we perturb such a model by moving it effectively to the left of the AB branch.
It will fall into the "cooling" domain and hence will return to the "standard" curve: the
AB branch is obviously stable against thermal perturbations! If we do the same to a point
on the BC branch we will have the perturbed models also to the left but this time below the
"standard" curve and "cooling" will mean moving down, i.e. further away from the initial
location: the BC branch is thermally unstable!
What then is the nature and what are the consequences of instability in the outer
parts of the disks of dwarf novae? Suppose the rate of mass-transfer from the secondary
would require - under stationary conditions - that the temperature of the outermost parts
of the disk be below the critical value of log T_e = 3.8 (marked with an arrow in the right
margin of Fig.1). Let us assume, for the sake of clarity, that the structure of these outer
parts was described by a point somewhere on the BC branch. And suppose that due to a random
perturbation it was forced to move up to the AB branch. (In fact it is irrelevant how we
start. Due to the presence of instabilities we must end on the ABFE loop, as described
below.) A model on the AB branch has a local accretion rate higher than the rate at which
the material is supplied from the outside. This implies that Sigma must decrease and our model
will move down and to the left along the AB branch. At point B the tendency for decreasing
Sigma will still continue forcing our model to become thermally unstable: once in the "cooling"
domain it will move down in a thermal time-scale; at the same time E will initially
continue to decrease, but later will begin to increase. The thermal stability will return
at point F where the local accretion rate is smaller than the mass-transfer rate. Hence E
must increase and our model will move along the EF branch up and to the right. The loop is
completed by a fast crossing of the "heating" domain from E to A, where the cycle begins
again.
In this simplified picture the transition from F to E corresponds to the interval
between the outbursts, when the material supplied from the secondary
is mostly accumulated in the outer parts of the disk. The remaining part of the loop:
EABF corresponds to an outburst and, in particular, the transition from A to B represents
dumping of the previously accumulated material onto the central star. It can be roughly
estimated that the time scale of the transition from A to B is about 10 times shorter than
that from F to E.
It is clear that the unstable behaviour in the outermost parts, as described above,
will affect the situation in the inner regions. Specifically, the local accretion rate in
the outermost parts - which is variable - controls the rate of mass-transfer to the inner
regions. It is therefore clear that a full, time-dependent model of the entire disk is
necessary before a meaningful comparison with observations can be made.
To show that the picture presented above is consistent with the observational data
one can mention spectral energy distributions of disks in dwarf novae (cf. Szkody 1981)
which are generally inconsistent with predictions based on stationary accretion models. In
particular, they suggest rather low temperatures being present somewhere; presumably in the
outermost parts of these disks. For example, the infrared data for EX Hya (Sherrington et
al. 1980) imply temperatures below 2000 K! This is consistent with temperatures
characteristic for the EF branch in Fig. 1. In particular, this evidence speaks in favour
of the ABFE loop. Within uncertainties of the available models another alternative would be
to consider the ABDC loop: should point D be located further to the left there would indeed
be no necessity to involve the EF branch. But the temperatures on the CD branch are above
4000 K. Quite in general, however, we cannot exclude that in different systems we can have
different situations: either the ABFE loop or the ABDC loop. And speculating still further,
that the existence of these two possibilities may explain outbursts and super-outbursts in
the SU UMa type systems.
Let me conclude with two remarks. First, it is rather surprising and very
remarkable that in spite of our continuing ignorance with respect to the nature of
viscosity it is possible to explain the nature of dwarf novae with good prospects for
studying their behaviour in a more quantitative way. Second, that once we have detailed,
time-dependent models for disks in those systems, by comparing them with the wealth of the
observational constraints we should be able to say more about the nature of viscosity.
Dwarf novae may help us to understand the accretion phenomena in many other objects.
References:
Canizzo, J.K., Ghosh, P., Wheeler, J.C. 1982, Ap.J. (in press).
Meyer, F., Meyer-Hofmeister, E. 1981, Astr.Ap., 104, L10.
Meyer, F., Meyer-Hofmeister, E. 1982, Astr.Ap., 106, 34.
Pringle, J.E. 1981, Ann. Rev. Astr. Ap., 19, 137
Robinson, E.L. 1976, Ann. Rev. Astr. Ap., 14, 119.
Sherrington, M.R., Lawson, P.A., King, A.R., Jameson, R.F. 1980, Mon. Not.R.
astr. Soc., 191, 185.
Smak, J. 1982a, Acta Astr., 32 (in press).
Smak, J. 1982b, Acta Astr., 32 (in press).
Smak, J. 1982c, (in preparation).
Szkody, P. 1981, Ap.J., 247, 577.
Figure 1 Schematic representation of the log T -log Sigma diagram. The log T
values for points B, D, F marked on the left margin are only approximate and
depend on the details of the vertical structure.
point is that branches BC and DE are unstable against perturbations in Sigma (Meyer and
Meyer-Hofmeister 1981, Smak 1982a); they are also unstable against thermal perturbations
(Smak 1982c).
In the case of stationary accretion we have
F = sigma*T_e^4 = 3M^dot GM/8*pi*r^3
which shows that the lowest temperature will be at the outer edge of the disk and its value
will be determined by the product M^dot/r^3. Critical analysis of the observational data
(Smak 1982b) shows that in the case of novae and nova-like objects, i.e. in the case of
disks with presumably stationary accretion, the temperatures of their outermost parts are
higher than log T_e = 3.8 (corresponding to the critical point B in Fig.1). In the case of
dwarf novae, however, primarily due to lower accretion rates, the temperatures of the
outermost parts of their disks would - under stationary conditions - be below the critical
value. Hence in this case we must expect instabilities.
So far I have discussed models in thermal equilibrium. Let us now consider possible
deviations from the thermal equilibrium, i.e. models which include cooling or heating of
the disk. Crude calculations show (Smak 1982c) that models with cooling are located to the
left, while models with heating - to the right of the "standard" curve in the T_e - Sigma
diagram. Suppose a local structure of the disk is represented by a point somewhere on the
AB branch and we perturb such a model by moving it effectively to the left of the AB branch.
It will fall into the "cooling" domain and hence will return to the "standard" curve: the
AB branch is obviously stable against thermal perturbations! If we do the same to a point
on the BC branch we will have the perturbed models also to the left but this time below the
"standard" curve and "cooling" will mean moving down, i.e. further away from the initial
location: the BC branch is thermally unstable!
What then is the nature and what are the consequences of instability in the outer
parts of the disks of dwarf novae? Suppose the rate of mass-transfer from the secondary
would require - under stationary conditions - that the temperature of the outermost parts
of the disk be below the critical value of log T_e = 3.8 (marked with an arrow in the right
margin of Fig.1). Let us assume, for the sake of clarity, that the structure of these outer
parts was described by a point somewhere on the BC branch. And suppose that due to a random
perturbation it was forced to move up to the AB branch. (In fact it is irrelevant how we
start. Due to the presence of instabilities we must end on the ABFE loop, as described
below.) A model on the AB branch has a local accretion rate higher than the rate at which
the material is supplied from the outside. This implies that Sigma must decrease and our model
will move down and to the left along the AB branch. At point B the tendency for decreasing
Sigma will still continue forcing our model to become thermally unstable: once in the "cooling"
domain it will move down in a thermal time-scale; at the same time E will initially
continue to decrease, but later will begin to increase. The thermal stability will return
at point F where the local accretion rate is smaller than the mass-transfer rate. Hence E
must increase and our model will move along the EF branch up and to the right. The loop is
completed by a fast crossing of the "heating" domain from E to A, where the cycle begins
again.
In this simplified picture the transition from F to E corresponds to the interval
between the outbursts, when the material supplied from the secondary
is mostly accumulated in the outer parts of the disk. The remaining part of the loop:
EABF corresponds to an outburst and, in particular, the transition from A to B represents
dumping of the previously accumulated material onto the central star. It can be roughly
estimated that the time scale of the transition from A to B is about 10 times shorter than
that from F to E.
It is clear that the unstable behaviour in the outermost parts, as described above,
will affect the situation in the inner regions. Specifically, the local accretion rate in
the outermost parts - which is variable - controls the rate of mass-transfer to the inner
regions. It is therefore clear that a full, time-dependent model of the entire disk is
necessary before a meaningful comparison with observations can be made.
To show that the picture presented above is consistent with the observational data
one can mention spectral energy distributions of disks in dwarf novae (cf. Szkody 1981)
which are generally inconsistent with predictions based on stationary accretion models. In
particular, they suggest rather low temperatures being present somewhere; presumably in the
outermost parts of these disks. For example, the infrared data for EX Hya (Sherrington et
al. 1980) imply temperatures below 2000 K! This is consistent with temperatures
characteristic for the EF branch in Fig. 1. In particular, this evidence speaks in favour
of the ABFE loop. Within uncertainties of the available models another alternative would be
to consider the ABDC loop: should point D be located further to the left there would indeed
be no necessity to involve the EF branch. But the temperatures on the CD branch are above
4000 K. Quite in general, however, we cannot exclude that in different systems we can have
different situations: either the ABFE loop or the ABDC loop. And speculating still further,
that the existence of these two possibilities may explain outbursts and super-outbursts in
the SU UMa type systems.
Let me conclude with two remarks. First, it is rather surprising and very
remarkable that in spite of our continuing ignorance with respect to the nature of
viscosity it is possible to explain the nature of dwarf novae with good prospects for
studying their behaviour in a more quantitative way. Second, that once we have detailed,
time-dependent models for disks in those systems, by comparing them with the wealth of the
observational constraints we should be able to say more about the nature of viscosity.
Dwarf novae may help us to understand the accretion phenomena in many other objects.
References:
Canizzo, J.K., Ghosh, P., Wheeler, J.C. 1982, Ap.J. (in press).
Meyer, F., Meyer-Hofmeister, E. 1981, Astr.Ap., 104, L10.
Meyer, F., Meyer-Hofmeister, E. 1982, Astr.Ap., 106, 34.
Pringle, J.E. 1981, Ann. Rev. Astr. Ap., 19, 137
Robinson, E.L. 1976, Ann. Rev. Astr. Ap., 14, 119.
Sherrington, M.R., Lawson, P.A., King, A.R., Jameson, R.F. 1980, Mon. Not.R.
astr. Soc., 191, 185.
Smak, J. 1982a, Acta Astr., 32 (in press).
Smak, J. 1982b, Acta Astr., 32 (in press).
Smak, J. 1982c, (in preparation).
Szkody, P. 1981, Ap.J., 247, 577.
SEPARATION OF WZ SAGITTAE STARS FROM FAST NOVAE BY A PURELY PHOTOMETRIC CRITERION G.A. Richter Zentralinstitut fur Astrophysik der Akademie der Wissenschaften der DDR Sternwarte Sonneberg WZ Sagittae stars are a small subgroup of dwarf novae with mean cycle lengths of several years and amplitudes with more than 7 mag. There are actually 4 members: WZ Sge, WX Cet, AL Com, UZ Boo. Their absolute magnitude during outburst amounts to +2M ...+4M . Their eruption light curves are very similar to those of fast novae, which have absolute magnitudes of about -8M. But their outburst spectra and physics of eruption are distinct. 20 to 30 days after the outbursts WZ Sge, AL Com and probably WX Cet have an abrupt brightness decrease of several magnitudes within about 1 day which is followed in some cases by a sudden return to the original value. If this should turn out to be a common property of all WZ Sge stars, it could be used as a means of separating WZ Sge stars from fast novae if no outburst spectra are available. Nova V 592 Her (1968) and the supposed supernova 1971 in M 31 would then have to be classified as WZ Sge stars.
PHOTOELECTRIC OBSERVATIONS AND PRELIMINARY ANALYSIS
OF THE VARIABLE WHITE DWARF R 808
G. Kov·cs
Konkoly Observatory of the Hungarian Academy of Sciences
H-1525, Budapest, P.O. Box 67, Hungary
The photoelectric variability of R 808 was discovered by McGraw and Robinson
(1976). From four nights of observation they concluded that the light variation was
seemingly irregular with a quasiperiodicity at ~ 1.2 mHz.
New photoelectric data of R 808 were obtained by the 100 cm telescope at Konkoly
Observatory's mountain station in the spring of 1982. Altogether about 14 hours of data
were accumulated on four not consecutive nights by the same photometer and data acquisition
system as described earlier by Kov·cs (1981). We have used "white light" (no colour filter)
and an integration time of 10 s for all our measurements. Because of computer dead-time and
the printing of each item of data after integration, the sampling time was somewhat longer
than 10 s, viz. ~ 10.26s. As the observations were made by a single-channel photometer, the
data were seriously affected by atmospheric effects. Any possible long term variations of
the data have been filtered out by use of polynomial fits to each run. The residuals have
been analysed via FFT. One of our most reliable light curves and power spectra is shown in
Fig. 1. Measured intensities have not been reduced to magnitude scale, but the total range
of variation after the polynomial fit corresponds to about 0.3 mag. The light variation of
of ~800 s with an amplitude of ~0.15 mag is clearly seen at the second half of the light
curve. The power spectrum exhibits this feature at ~1.2 mHz. The origin of the other
significant peak at ~0.26 mHz is somewhat obscure because such a long term variation can
also be caused by non-stellar phenomena (transparency changes, artificial effects of the
polynomial fit).
Analysis of the other runs led to similar results. In each case a more or less
stable frequency pattern was observed at around 0.26 , 1.2 mHz and (at a very low level)
between 7 and 8 mHz.
It is clear that the light variation of R 808 cannot be represented by a simple
frequency pattern. The question whether or not R 808 has a stable frequency spectrum can
only be answered by further observations of low noise level.
 Figure 1. Photoelectric light curve and power spectrum of R 808 from 1st to 2nd April 1982.
Uppermost part of the figure shows the original data obtained in unfiltered light. Applying
a seventh order polynomial fit to these data gave the curve in the middle of the figure.
Intensities (star+sky) are measured in the same (arbitrary) units for both curves. Starting
time: 23h 04m00s UTC; each point represents a 10 s integration; the number of points is
1024. The power spectrum was normalized to unity at its highest peak.
References:
Kov·cs, G. 1981, Acta Astr., 31, 207.
McGraw, J.T., Robinson, E.L. 1976, Astrophys. J., 205, L155.
Figure 1. Photoelectric light curve and power spectrum of R 808 from 1st to 2nd April 1982.
Uppermost part of the figure shows the original data obtained in unfiltered light. Applying
a seventh order polynomial fit to these data gave the curve in the middle of the figure.
Intensities (star+sky) are measured in the same (arbitrary) units for both curves. Starting
time: 23h 04m00s UTC; each point represents a 10 s integration; the number of points is
1024. The power spectrum was normalized to unity at its highest peak.
References:
Kov·cs, G. 1981, Acta Astr., 31, 207.
McGraw, J.T., Robinson, E.L. 1976, Astrophys. J., 205, L155.
PHYSICAL PROPERTIES OF STELLAR FLARES L.V. Mirzoyan Byurakan Astrophysical Observatory Armenia, U.S.S.R. The study of flare stars has two aspects: evolutionary and physical. Flare stars represent one of the earlier stages of stellar evolution and their observation from an evolutionary point of view has already been discussed (see, for example [1]). Here we are concerned with the physical properties of flare radiation. Light curves. The light curves of flares obtained with high resolution in time are generally complex and can be presented as the superposition of the curves of two or more flares [2]. The time interval between the maximum and the second peak is less than 1 min in about 50% of cases and less than 5 min in 95% of cases. The probability of there being multipeaked light curves of flares increases with flare energy and becomes larger than 0.95 for the observed largest energies. Colour indices. The mean colours U-B and B-V of flare radiation in maximum is practically the same for the UV Ceti type stars and the flare stars in stellar aggregates [4]. But they change significantly during flares indicating that the spectral composition of flare radiation changes in different phases of flares. A correlation between the colours of flare radiation in maximum and the increasing time of the corresponding flare is observed [3]. Spectra. The increasing of the flare light up to a maximum is always due to the continuous radiation. The line emission is a secondary factor and usually lasts longer than continuous flare radiation [5]. Mean frequencies. The mean frequency of flares for one single star increases rapidly to smaller flare energies and to shorter wavelengths. It increases also to low luminosities of stars [6]. In aggregates there exists a certain distribution function of mean frequencies for the flare stars. It can be determined from the observations using the chronologies of the first and the second flares of stars [7]. This distribution function is different for different aggregates [7,8]. "Fast" and "slow" flares. All flares can be divided into two groups: "fast" and "slow", according to the time of increase in luminosity [9]. These two kinds of flares have quite different properties (time of increase in luminosity, mean frequency, colours). In fact the differences between them change continuously with time of increase in luminosity. Problems. For the further physical study of stellar flares the following observations seem to be important: 1. Synchronous photoelectric observations of flares of UV Ceti type stars with very high resolution in time (~0.l s) in few spectral bands, particularly with narrow filters. 2. Simultaneous spectral and photoelectric observations of flares of the UV Ceti type stars. 3. Far ultraviolet and X-ray observations of flare stars in minimum light. 4. Simultaneous photographic and radio observations of flares in stellar aggregates. References: [1] Ambartsumian, V.A., Mirzoyan, L.V.: In: New Directions and New Frontiers in Variable Star Research, IAU Coll. No. 15, Verˆff. Bamberg, 9, No. 100, 98, 1971. [2] Mirzoyan, L.V.: In: Flare Stars, Fuors and Herbig-Haro Objects, ed.: Mirzoyan, L.V., Ac. Sci. Armenian SSR, Yerevan, 1980, p. 45. [3] Mirzoyan, L.V., Melikian, N.D.: in preparation. [4] Mirzoyan, L.V., Chavushian, H.S., Melikian, N.D., Natsvlishvili, R. Sh., Ohanian, G.B., Hambarian, V.V., Garibjanian, A.T.: Astrofizika, 17, 197, 1981. [5] Moffett, T.J., Bopp, B.W.: Astrophys. J., Suppl., 31, 61, 1976. [6] Mirzoyan, L.V.: In: Stellar Instability and Evolution, Ac. Sci. Armenian SSR, Yerevan, 1981. [7] Ambartsumian, V.A.: Astrofizika, 14, 367, 1978. [8] Parsamian, E.S.: Astrofizika, 16, 377, 1980. [9] Haro, G.: In: Stars and Stellar Systems, Vol. 7, eds.: Middlehurst, B.A. and Aller, L.H., Univ. of Chicago Press, Chicago, 1968, p. 141.
FLARE STAR SEARCH IN THE PERIOD 1979-1982
M.K. Tsvetkov
Department of Astronomy and National Astronomical Observatory
Bulgarian Academy of Sciences
This work summarizes the main results about the monitoring observations and
investigation of the flare stars which were obtained at the Department of Astronomy with
National Astronomical Observatory (NAO) of the Bulgarian Academy of Sciences in the period
1979-1982.
The observations were made with the 50/70 cm Schmidt and the 60 cm Cassegrain
telescopes at NAO - Rozhen. The aggregates Orion (M 42), Pleiades, Cygnus (NGC 7000 and
gamma Cygni) as well as other aggregates and the flare star EV Lac were included in the
total observational programme. During about 450h total effective time of observation at NAO
- Rozhen, Byurakan Observatory and Konkoly Observatory 40 new flare stars were discovered
(Table I). The data about the Rozhen monitoring observations are given in Table II.
Table I Monitoring observations in 1979 - 1982
Aggregate T_eff New flare stars Flare-ups of known
flare stars
NGC 7000 46h40m 4 2
gamma Cygni 208 00 14 1
Pleiades 150 05 9 23
Orion (M42) 44 50 10 3
Field 3
Total = 449h35m 40 29
Table II Monitoring observations at Rozhen in 1979 - 1982
Aggregate T_eff New flare stars Flare-ups of known
flare stars
gamma Cygni 186h00m 11 1
Pleiades 110 45 5 14
Orion (M42) 44 50 10 3
Total = 341h35m 26 18
The flare events of CE Orionis and the star Rozhen No.11 - Ori (Delta m_u ~ 8.0m)
are of special interest, since CE Ori is a typical T Tauri star (IBVS Nos. 1889 and 2132).
Table III and Figures 1 and 2 present some data about the flares of CE Ori and Rozhen No.
11 - Ori.
Table III Photometric data about the flare-up of CE Ori on
14.01.1980
No U. T. m_u Delta m_u
1 22h16m (17.2m
2 22 26.5 ~16.9: ~0.3m:
3 22 37 (17.2
4 22 47.5 14.7 2.5
5 22 58 15.6 1.6
6 23 08.5 16.9 0.3
 Figure 1 Flare-up of CE Ori (IBVS No. 1889)
 Figure 2 Flare-up of Rozhen No. 11 - Ori (IBVS No. 2132)
HIGH FLARE ACTIVITY OF THE STAR AD Leo IN 1982 K.P. Panov, M. Grigorova, A. Tsintsarova Department of Astronomy with National Astronomical Observatory Bulgarian Academy of Sciences, 7 November str. 1. Sofia, Bulgaria Photoelectric monitoring observations of the flare star AD Leo were carried out on 6 nights in February and March 1982 in the National Astronomical Observatory, using the 60 cm telescope and the photoelectric equipment. The one-channel UBV photoelectric photometer (Panov et al., 1982) operated in photon-counting mode. The observations were carried out in U colour with an integration of 1 sec. The standard deviation of random-noise fluctuations was 0.03 mag for all observations. During the total of 17h57m monitoring time 23 flares were observed. They are distributed over time as follows: 16/17.02.1982 5 flares in 3h03m monitoring time 18/19.02.1982 5 flares in 3h04m monitoring time 18/19.03.1982 1 flare in 2h10m monitoring time 25/26.03.1982 7 flares in 3h45m monitoring time 26/27.03.1982 3 flares in 3h29m monitoring time 27/28.03.1982 2 flares in 2h26m monitoring time The observed flare frequency was thus 3 - 4 times higher than the same frequency obtained by others for AD Leo. Reference: Panov, K.P., Pamukchiev, I.Ch., Christov, P.P., Petkov, D.I., Notev, P.T., Kotsev, N.G. 1982, Comptes Rendus of the Bulgarian Academy of Sciences, in press.
BINARY STARS AMONG THE PHYSICAL VARIABLES L. Szabados Konkoly Observatory of the Hungarian Academy of Sciences H-1525, Budapest, P.O. Box 67, Hungary Abstract This review summarizes our knowledge about the frequency of binaries among the various types of variables. Attention is drawn to some interesting phenomena observed in binary systems containing physical variables. Introduction In view of the known commonness of duplicity it is of interest to investigate to what extent the known types of variable stars are members in binary systems and how far binary nature affects their behaviour. Duplicity and its consequences were first reviewed by Larsson-Leander (1971). The review of Payne-Gaposchkin (1978) lists a large number of examples of binaries among physical variables. The last decade has demonstrated that the duplicity among variable stars deserves more attention. Although there are several types of variables (e.g. dwarf novae) where the duplicity is treated satisfactorily, this is not the case where the frequency of binaries is far from 100 per cent (e.g. pulsating variables). Because of the presence of a close companion physical variability may be induced in an otherwise non-variable star and the behaviour of a physically variable star may be more or less influenced by the duplicity. Larsson-Leander (1971) lists three kinds of effects arising from the duplicity: gravitational effects, radiation effects and effects due to gaseous streams and mass transfer between the components. Gravitational effects may be important in pulsating variables where a sufficiently close companion produces tides that affect the physical conditions in the outer layers of the pulsating star, causing non-radial effects. Gaseous streams and mass transfer play an important role in cataclysmic variables. One would expect that the frequency of binary stars among the physical variables does not differ significantly from the frequency observed in normal field stars. The discovery of the duplicity of several variables is not a simple task. There are numerous methods to reveal the binary nature but their efficiency varies for different types of physical variables, and strong selection effects are present that work against the discovery of binaries. The methods are as follows: 1. Visual discovery (e.g. Mira Ceti) 2. Eclipsing light variation 3. Radial velocity variation 4. Two components in the same spectrum (symbiotic stars) 5. Other spectral features (e.g. decreased ratio of emission/continuum in WR binaries, decreased IR masering in Miras) 6. Photometric evidences: - the reduced amplitude of the light curve - the general blueness (or redness) of the colour indices if the effective temperature of the companion is quite different from that of the variable (but interstellar reddening may mask the blueness) - the ratio of the amplitude in different photometric bands is different from the normal value - the "two-colour diagram" method (Madore, 1977) - the "phase shift" technique (Fernie, 1980) 7. Light-time effect in the O-C diagram (Coutts, 1971; Szabados, 1980 and 1981) which is especially useful when the colour of the companion does not differ considerably from that of the variable. Pulsating variables In addition to the light-time effect, there is another interesting phenomenon observed in the O-C diagrams of several binary Cepheids, viz. the "rejump" of the period (Szabados, 1977, 1980, 1981). The rejump of the period may occur suddenly, in this case the phenomenon can be interpreted as a phase shift in the phase of the maxima, but sometimes the return to the earlier pulsation period is slower, an intermediate period can be well determined. Rejump of the period was found at eight Cepheids in the northern sky and no single Cepheids show this phenomenon. It is highly interesting that similar phenomenon can be observed in the O-C diagram for supermaxima of SU UMa type dwarf novae (Vogt, 1980). The rough constancy of the period of the supermaxima and its change may be caused by the rotating g-modes of the Roche-lobe filling secondary companion. As an analogy, the rejump in the period of Cepheids may be caused by some non-radial effect since only binary Cepheids show rejumping period. However, the Cepheids are rather wide binaries and the non-radial effects due to the presence of the companion are expected not to be as pronounced as in dwarf novae. In multiple periodic variable stars, e.g. in Delta Scuti and Beta Canis Majoris stars the ratio of periods can also be explained by non-radial pulsation. Our knowledge about the duplicity of RR Lyrae variables is very limited. The only reliable binary system which contains RR Lyrae type variable is V80 in the UMi dwarf galaxy. The ratio of its pulsation and orbital periods is very close to 1:4. Such a "synchronization" between pulsational and orbital motion has also been noticed in other binary systems containing a pulsating component (Frolov et al., 1980). This kind of resonance is very interesting and promising, but no firm conclusion can be drawn as to the frequency of its occurrence. It is worthy of notice that RR Leo may be another RR Lyrae star in a binary system if the wave in its O-C diagram proves to be periodic (Ol·h and Szeidl, 1978). Among the red giant variables we again find a small proportion of binaries, nevertheless there are very interesting binary systems among them. Both Mira Ceti and R Hydrae have faint visual companions. The period of R Hydrae decreased from 500 to 400 days in about two centuries. The companion of Mira Ceti is the faint blue variable star VZ Ceti whose eruptive behaviour is certainly affected and probably caused by material flowing from its red giant companion. R Aqr is an eclipsing binary. The duration of the eclipses is 8 years, and the eclipse itself is caused by a gas cloud around the blue secondary (Willson et al., 1981). Moreover, in 1885 a slow outburst was observed in this system. One of the most interesting variables is the slow nova (or symbiotic variable) RR Telescopii. As the pre-outburst light curve shows, the red component became a Mira variable several years before the nova outburst (Robinson, 1975). The periodic light variation (P=380d) cannot be traced in visual light after the nova outburst, but can well be observed in the infrared. The period in the infrared is now the same as was in visible light prior to the outburst (Feast, 1979). It is obvious that there must have been a strong physical connection between the start of Mira type variation and the subsequent nova outburst. The IR technique gave a new possibility to reveal Miras in binary systems (Feast, 1980). Several Miras with companions have unusually weak or absent OH/H_2O masering despite being bolometrically bright objects. In these cases (e.g. Mira Ceti), the projected distances of the companions from the Miras are in the range 10^15-10^17 cm whilst the radius of a typical masering circumstellar region is usually taken as 10^16 cm. Evidently in these circumstances the companion can have a considerable influence on the masering gas. Physical variability can be found among the Zeta Aurigae type eclipsing variables, too. The red supergiant component of the long period eclipsing binary VV Cephei shows semi- regular variation with a period of 118 days (Mc Cook and Guinan, 1978). Variable stars of lower luminosity As is well known, the RS CVn stars are all binaries and at the same time physical variables, too, owing to the star-spots generated by the surface activity. In many of their optical characteristics the BY Draconis variables are similar to RS CVn binaries. A combination of both rapid rotation and extensive convection zones provides a necessary and sufficient condition for large scale stellar activity in late type stars. Since at least one of the BY Dra stars (AU Mic) is almost certainly single (Caillault, 1982), this suggests that rapid rotation and not duplicity is the determining factor in defining the level of stellar activity in such variables. Duplicity may only be relevant as a means of ensuring rapid rotation through synchronization. The FK Comae stars form a new group of chromospherically active variable stars. According to a recent hypothesis (Bopp and Stencel, 1981), FK Comae stars are coalesced binaries, perhaps evolved W UMa stars. It is a common opinion that the proportion of binaries among the pre-main sequence variables is quite high. In this case the presence of wide emission lines can easily be explained by the mass exchange between the components. Nevertheless, the only convincing example among the T Tauri stars is RY Tau. The occurrence of binaries among flare stars is higher than that of binaries containing normal stars of late spectral type. Several cases are known where both components of the binary are flare stars (Mirzoyan, 1981). Cataclysmic variables Among the cataclysmic variables the occurrence of binaries is the highest among the variable stars, the outburst of these stars is closely connected with the duplicity. We have observational evidence that about 60% of the total number of novae are binaries, however it is usually assumed that all novae are binary systems, just because there is no better explanation. The presence of several novae in globular clusters may be an argument against their overall duplicity (Webbink, 1980). As to the recurrent novae, a very interesting observational fact should be mentioned. The recurrent nova T CrB has been observed to erupt four times with novae or flare-like events with peak amplitude of one magnitude or greater, and all these events occurred in nearly the same orbital phase (Palmer and Africano, 1982). The dwarf novae are binaries without any exception. The intriguing property of the SU UMa subgroup was mentioned earlier in this paper. Similarly, the UX UMa stars are all binaries. The symbiotic stars have been shown convincingly to be binaries. A recent review and their new classification is given by Allen (1979). The AM Herculis type stars (polars) are magnetic binaries, in which a very strong magnetic field together with a high accretion rate is likely to lead to the steady burning with no outburst. The X-ray binaries are binaries per definitionem. It is worth mentioning that besides the massive systems some other physical variables can also be placed among the X-ray binaries: e.g. several Be systems, the HZ Her type variables, the above-mentioned AM Her stars, several novae and RS CVn systems. The Hubble-Sandage variables are the most luminous stars in external galaxies. Spectroscopically they closely resemble dwarf novae. Bath (1980) suggested that the close correspondence between the spectral appearance of the two classes combined with the difference in luminosity is well accounted for by a model of Hubble-Sandage variables in which the same physical processes occur but on a larger scale. According to this hypothesis H-S variables are binary systems and the accretion rates would be 10^20 - 10^24 g/s, maximum disk temperatures are the same (10^4 - 4*10^4 K) as quiescent dwarf novae with accretion rates 10^14 - 10^17 g/s. The disk structure will be similar, simply larger radii. This larger disk has a luminosity ~ 10^38 erg/s. According to Bath the closest related object Eta Carinae is also a massive interacting binary and its outburst in the 19th century was an accretion driven nova explosion. Other physical variables The observed slow rotation of Ap stars may well be caused by their membership in binary system, where a synchronization causes slow rotation. The observed frequency of binaries among the Ap stars seems to contradict this: various authors give 24 - 45% for their occurrence (Jaschek and Jaschek, 1975). Another explanation for the slow rotation may be the magnetic braking. The problem with this latter mechanism is that it would result in circular orbit, but the observed orbits of Ap stars in spectroscopic binaries are eccentric. The estimation of the occurrence of binaries among the Wolf-Rayet stars is rather uncertain. The concensus of opinion is that most WR stars are members in binary systems, and binary nature appears fundamental to the formation of WR stars except possibly for the more luminous WN7/WN8 subgroup (Moffat and Seggewiss, 1980). Most central stars of planetary nebulae show a continuous spectrum, some have WR type spectra and others show Of type spectra with both absorption and emission lines. However, there are some peculiar cases where the central stars show late type spectra and yet the nebulae show high excitation lines. One possible explanation for this discrepancy is that these central stars are binary systems and the late type spectra refer to the companion stars of Table I Type of variability Occurrence of Typical representatives binaries beta CMa ~25% 16 Lac, alpha Vir Cepheids ~25% SU Cyg, CE Cas, BM Cas delta Sct, Dwarf cepheids ~25% SZ Lyn, AB Cas RR Lyr probably low V80 in UMi Mira probably low omicron Cet, R Hya, R Aqr Semiregular ? VV Cep RS CVn ~100% RS CVn BY Dra not 100% BY Dra FK Com ~100% FK Com, UZ Lib T Tau 30 - 50% RY Tau flare stars >60% Proxima Cen, UV Cet Novae ~<100% DQ Her, RR Tel Recurrent novae ~100% T CrB Dwarf novae 100% U Gem, SU UMa, Z Cam UX UMa 100% UX UMa Symbiotic variables 100% AG Peg AM Her 100% AM Her Hubble-Sandage var., eta Car 100% ? eta Car Ap stars 24 - 45% AR Aur Wolf-Rayet stars 80% V 444 Cyg central stars of plan. neb. not 0% IC 2120, UU Sge Fuors 100% ? FU Ori the hot blue stars of the PN. Interestingly enough, a binary star model has been suggested for the fuors, too (Chochol and Tremko, 1980). A short summary of the paper can be found in Table I. This review, however, does not give a complete listing of binary physical variables. There are several types of variables (e.g. W Vir and R CrB) which have not been treated in the literature from the point of view of duplicity. The author wishes to thank Professor L.V. Mirzoyan for his valuable comments. References: Allen, D.A. 1979, In: Proc. I.A.U. Coll. No. 46, Ed.: Bateson et al., Univ. of Waikato, New Zealand, p. 125. Bath, G.T. 1980, In: Close Binary Stars: Observations and Interpretation, Ed.: Plavec et al., Reidel, Dordrecht, p. 155. Bopp, B.W., Stencel, R.E. 1981, Astrophys. J., 247, L131. Caillault, J.-P. 1982, Astron. J., 87, 558. Chochol, D., Tremko, J. 1980, In: Flare Stars, Fuors and Herbig-Haro Objects, Ed.: L.V. Mirzoyan, Erevan, p. 240. Coutts, C.M. 1971, In: Proc. I.A.U. Coll. No. 15, Verˆff. Remeis Sternwarte Bamberg, IX, Nr. 100, p. 238. Feast, M.W. 1979, In: Proc. I.A.U. Coll. No. 46, Ed.: Bateson et al., Univ. of Waikato, New Zealand, p. 147. Feast, M.W. 1980, In: Variability in Stars and Galaxies, Proc. Vth E.R.M.A., Institut d' Astrophysique, Liege, p. B.1.1. Fernie, J.D. 1980, Astron. Astrophys., 87, 227. Frolov, M.S., Pastukhova, E.N., Mironov, A.V., Moshkalev, V.G. 1980, Inf. Bull. var. Stars, No. 1894. IBVS 1894 Jaschek, C., Jaschek, M. 1975, In: Physics of Ap Stars, Proc. I.A.U. Coll. No. 32, Ed.: Weiss et al., Univ. Sternw. Wien, Vienna, p. 219. Larsson-Leander, G. 1971, In: Proc. I.A.U. Coll. No. 15, Verˆff. Remeis Sternw. Bamberg, IX, Nr. 100, p. 185. Madore, B.F. 1977, Mon. Not. R. astr. Soc., 178, 505. McCook, G.P., Guinan, E.F. 1978, Inf. Bull. var. Stars, No. 1385. IBVS 1385 Mirzoyan, L.V. 1981, Nestatsionarnost I Evolutsiya Zvezd, Acad. Sci. Arm. S.S.R., Erevan, p. 145. Moffat, A.F.J., Seggewiss, W. 1980, In: Close Binary Stars: Observations and Interpretation, Ed.: Plavec et al., Reidel, Dordrecht, p. 181. Ol·h, K., Szeidl, B. 1978, Mitt. Sternw. ung. Akad. Wiss., Nr. 71.CoKon 71 Palmer, L.H., Africano, J.L. 1982, Inf. Bull. var. Stars, No. 2069. IBVS 2069 Payne-Gaposchkin, C. 1978, Ann. Rev. Astron. Astrophys., 16, 1. Robinson, E.L. 1975, Astron. J., 80, 515. Szabados, L. 1977, Mitt. Sternw. ung. Akad. Wiss., Budapest, Nr. 70.CoKon 70 Szabados, L. 1980, Mitt. Sternw. ung. Akad. Wiss., Budapest, Nr. 76.CoKon 76 Szabados, L. 1981, Commun. Konkoly Obs. Hung. Acad. Sci., No. 77.CoKon 77 Vogt, N. 1980, Astron. Astrophys., 88, 66. Webbink, R.F. 1980, In: Close Binary Stars: Observations and Interpretation, Ed.: Plavec et al., Reidel, Dordrecht, p. 561. Willson, L.A., Garnavich, P., Mattei, J.A. 1981, Inf. Bull. var. Stars, No. 1961. IBVS 1961
V 1068 CYGNI - A LONG PERIOD RS CVn STAR? S. Rˆssiger Zentralinstitut f¸r Astrophysik Sternwarte Sonneberg, G.D.R. Photoelectric UBV observations of the eclipsing binary V 1068 Cygni were obtained in the years 1979 - 1981. The depths of the minimum in the separate colours are: Delta V = 0.30, Delta B = 0.58, Delta U = 0.93 mag. Moreover there is an indication of a migrating wavelike distortion in the light curve, as it occurs in the RS CVn stars. With respect to the orbital period of 42.7 days the system would then be a member of the long-period RS CVn group. Image tube spectra taken by P. Notni at the Tautenburg 2m telescope show that the components of the system have spectral types B5 - A5 and G8 II-III. The spectra do not reach the Ca II lines H and K. It is therefore impossible to decide on the presence of emission in those lines, which would be an important criterion of RS CVn stars and related objects. Further spectroscopic investigation is desirable.
SPOT ACTIVITY OF THE CLOSE BINARY SV Cam L. PatkÛs Konkoly Observatory of the Hungarian Academy of Sciences H-1525, Budapest, P.O. Box 67, Hungary Like other RS CVn systems, SV Cam has a migrating distortion wave. The amplitude of this wave is about 0.1 mag and it migrates towards increasing orbital phase. The wave is caused by dark spots on the surface of the secondary component. These spots migrate because of the differential rotation. The velocity of the migration is not constant, but its period must be about 400 days. To explain the observed light curve changes, we also have to assume the existence of white spots - on the surface of the primary component. The one indication for this was given by the light-up which appeared between J.D. 2442432 and J.D. 2442461. This light-up may have been caused by a gas stream falling down on the surface of the primary component. The simultaneously observed period increase also indicates mass transfer from the smaller secondary component to the primary. Another indication for the existence of a white spot on the surface of the primary component comes from the observations J.D. 2441978-981. Three independent light curves were obtained and in each of them there is a step at the bottom of primary minimum. This phenomenon can be explained by the eclipse of a white spot on the surface of the primary component. The brightness of this spot is not enough to observe it in full light, but in the case of a transit eclipse even small brightness differences on the surface of the eclipsed component can be established. On the light curves observed two weeks earlier and one month later (and on other light curves of SV Cam) no step at the bottom of primary eclipse is present. This means that the assumed white spot also migrates for the same reason as dark spots on the surface of the secondary component. My investigations suggest that the extended light curve variations in the system SV Cam are caused by both dark and white spots on the surface of the two components.
PHOTOELECTRIC MINIMA OF VW CEPHEI AND V 566 OPHIUCHI H.A. Mahdy and M.A. Soliman Helwan Institute of Astronomy and Geophysics Helwan, Egypt The eclipsing variables VW Cep and V 566 Oph were observed in B and V colours in Kottamia Observatory, Egypt, in 1981. The results of the photometry and the times of minima have been published in the Information Bulletin on Variable Stars, Nos. 2153 and 2154, respectively. The individual observations for both stars will be deposited in the Archives of Commission 27 of the IAU.
OBSERVATIONS OF A NEW MINIMUM IN OPTICAL RADIATION OF
X-RAY SOURCE KR AURIGAE
M. Popova, A. Antov and V. Popov
Department of Astronomy, Bulgarian Academy of Sciences
72 Lenin Boulevard, 1184 Sofia, Bulgaria
KR Aurigae attracts the attention of astronomers due to its unusual properties.
This variable was discovered by Popova (1960), who has also underlined its unique type of
variability (Popova, 1965). The results of spectrophotometric study confirmed the unusual
character of the object. The YY Ori type profile of Hbeta showed a mean accretion velocity of
about 3200 km/sec and a hypothesis of KR Aur being a possible black hole has been suggested
(Popova and Vitrichenko, 1978). On the basis of observations from the American satellite
HEAO-2, the star was recognized to be a source of soft X-ray radiation (Mufson et al., 1980).
In the National Astronomical Observatory of the Bulgarian Academy of Sciences at Rojen,
observations of KR Aurigae were carried out on 2 m RCC telescope and on a 500/700 mm
Schmidt telescope. The results display a significant change in the brightness of the star.
From December 1979 till March 1981 it remains at 13.5m as during the preceding years.
Variations of the order of some tenths of the magnitude are present. At the end of 1981 a
dip occurred and the variable attained 17m on 28 December 1981 (Popov, 1982).
 Figure 1
Observations over the next five months showed a gradual increase of brightness, reaching
14m on 19 May 1982 (Figure 1).
The observed minimum is in agreement with the mean cycle of 7-9 years in light
variations, suggested by Popova (1965).
Most of the photometric data on the variability of the star are obtained from
Sonneberg, Moscow and Harvard plate collections (Popova, 1975; Liller, 1980). On these
plates the star in minimum light is usually fainter than the limiting magnitude of the
plates. Only a few observations in minimum light with more powerful telescopes are
available. In order to fill the gaps in our observations during the last minimum,
contributions from other observatories would be highly appreciated.
Since the photometric behaviour of KR Aurigae is very complicated, regular
photometric and/or photoelectric patrol observations in different colours are very
desirable.
References:
Liller, M.H. 1980, Astron. J., 85, 1092.
Mufson, S.L., Wisniewski, W.Z., McMillan, R.S. 1980, IAU Circ., No. 3471.
Popova, M.D. 1960, Mitt. veranderl. Sterne, Nr. 463.
Popova, M.D. 1965, Peremennye Zvezdy, 15, 534.
Popova, M.D. 1975, Astrophys. Investigations, Sofia, 1, 68.
Popova, M.D., Vitrichenko, E.A. 1978, Astr. Zhu., 55, 765.
Popov, V.N. 1982, Inf. Bull. var. Stars, No. 2095. IBVS 2095
Figure 1
Observations over the next five months showed a gradual increase of brightness, reaching
14m on 19 May 1982 (Figure 1).
The observed minimum is in agreement with the mean cycle of 7-9 years in light
variations, suggested by Popova (1965).
Most of the photometric data on the variability of the star are obtained from
Sonneberg, Moscow and Harvard plate collections (Popova, 1975; Liller, 1980). On these
plates the star in minimum light is usually fainter than the limiting magnitude of the
plates. Only a few observations in minimum light with more powerful telescopes are
available. In order to fill the gaps in our observations during the last minimum,
contributions from other observatories would be highly appreciated.
Since the photometric behaviour of KR Aurigae is very complicated, regular
photometric and/or photoelectric patrol observations in different colours are very
desirable.
References:
Liller, M.H. 1980, Astron. J., 85, 1092.
Mufson, S.L., Wisniewski, W.Z., McMillan, R.S. 1980, IAU Circ., No. 3471.
Popova, M.D. 1960, Mitt. veranderl. Sterne, Nr. 463.
Popova, M.D. 1965, Peremennye Zvezdy, 15, 534.
Popova, M.D. 1975, Astrophys. Investigations, Sofia, 1, 68.
Popova, M.D., Vitrichenko, E.A. 1978, Astr. Zhu., 55, 765.
Popov, V.N. 1982, Inf. Bull. var. Stars, No. 2095. IBVS 2095
AQ LEONIS UPDATED M. Jerzykiewicz Wroclaw University Observatory, Poland and R.H. Schult and W. Wenzel Central Institute for Astrophysics, Sonneberg Observatory, G.D.R. All available photometric observations of the double-mode RR Lyrae variable AQ Leonis are examined. A mean B-V colour index is derived which places the star in the RR Lyrae gap at the transition line between the c- and a-type pulsators. The upper limit for the first-overtone to the fundamental switching rate is found to amount to between 5 and 10 per cent of the first-overtone amplitude over the last 20 years. An abrupt change of the first-overtone period apparently occurred in the early seventies.
AN INTERESTING VARIABLE IN M15
Katalin Barlai
Konkoly Observatory of the Hungarian Academy of Sciences
H-1525, Budapest, P.O. Box 67, Hungary
Among the RR Lyrae variables of the globular cluster M15 there is one - V 15 -
which calls our attention by its conspicuous O-C diagram (Fig. 1).
 Figure 1
Smith and Wesselink (1977) claim: "This interesting variable has undergone so great
a change in period during 74 years of observations that we cannot construct an unambiguous
phase diagram." Smith and Sandage (1981)
write: "A simple abrupt period change and a simple linear period increase both can be
excluded. Our phase diagram can be explained only if V 15 has undergone at least one period
increase near J.D. 2427000 and one period decrease near J.D. 2438000." ... "We feel that
the available observations do not permit an unambiguous description of the period behaviour
of V 15 between J.D. 2421000 and 2427000."
The observational material obtained in Budapest during the past 45 years suggests
the O-C diagram shown in Fig. 1. A large sudden change of the period is to be seen.
A model proposed by Sweigart and Renzini (1979) might offer a possibility to
interpret (the unusual shape of) this O-C diagram. In accordance with their model the
period changes of RR Lyrae stars can be explained by the development of a semiconvective
zone around the core of the star. The composition redistribution in the convective core due
to this zone results in a transfer of helium through this zone into the core by means of
small random mixing events altering the pulsation period of the star. This process
contributes substantially to the observed changes of the period in addition to the gradual
change in the composition due to nuclear burning. Period changes of both signs can be
produced by that process and the changes in the pulsations period are comparable with the
typically observed ones.
A theoretical horizontal branch track in the HRD obtained by taking into account
semiconvection describes two spikes. The evolutionary rate of change of the period (Figs. 2
and 3 of Sweigart and Renzini) shows large negative and positive changes of the period.
According to the authors large period changes would occur in roughly several centuries as
their reference model evolves through the spike.
Observations of RR Lyrae variables in globular clusters now cover about 80 years.
Among the 120 variables of M15 we found one single O-C diagram showing large period changes
within several years. Among the about 200 RR Lyrae variables of M3 we can also find one - V
58 - which shows similar behaviour in its O-C curve (Szeidl, 1965). This is not
inconsistent with the abundances of sudden large period changes predicted by this model, so
these unusual O-C diagrams are not to be discarded; they might be connected with the spike.
References:
Smith, H.A., Sandage, A. 1981, Astron. J., 86, 1870.
Smith, H.A., Wesselink, A.J. 1977, Astron. Astrophys., 56, 135.
Sweigart, A.V., Renzini, A. 1979, Astron. Astrophys., 71, 66.
Szeidl, B. 1965, Mitt. Sternw. ung. Akad. Wiss., Budapest-Szabads·ghegy, No. 58.CoKon 58
Figure 1
Smith and Wesselink (1977) claim: "This interesting variable has undergone so great
a change in period during 74 years of observations that we cannot construct an unambiguous
phase diagram." Smith and Sandage (1981)
write: "A simple abrupt period change and a simple linear period increase both can be
excluded. Our phase diagram can be explained only if V 15 has undergone at least one period
increase near J.D. 2427000 and one period decrease near J.D. 2438000." ... "We feel that
the available observations do not permit an unambiguous description of the period behaviour
of V 15 between J.D. 2421000 and 2427000."
The observational material obtained in Budapest during the past 45 years suggests
the O-C diagram shown in Fig. 1. A large sudden change of the period is to be seen.
A model proposed by Sweigart and Renzini (1979) might offer a possibility to
interpret (the unusual shape of) this O-C diagram. In accordance with their model the
period changes of RR Lyrae stars can be explained by the development of a semiconvective
zone around the core of the star. The composition redistribution in the convective core due
to this zone results in a transfer of helium through this zone into the core by means of
small random mixing events altering the pulsation period of the star. This process
contributes substantially to the observed changes of the period in addition to the gradual
change in the composition due to nuclear burning. Period changes of both signs can be
produced by that process and the changes in the pulsations period are comparable with the
typically observed ones.
A theoretical horizontal branch track in the HRD obtained by taking into account
semiconvection describes two spikes. The evolutionary rate of change of the period (Figs. 2
and 3 of Sweigart and Renzini) shows large negative and positive changes of the period.
According to the authors large period changes would occur in roughly several centuries as
their reference model evolves through the spike.
Observations of RR Lyrae variables in globular clusters now cover about 80 years.
Among the 120 variables of M15 we found one single O-C diagram showing large period changes
within several years. Among the about 200 RR Lyrae variables of M3 we can also find one - V
58 - which shows similar behaviour in its O-C curve (Szeidl, 1965). This is not
inconsistent with the abundances of sudden large period changes predicted by this model, so
these unusual O-C diagrams are not to be discarded; they might be connected with the spike.
References:
Smith, H.A., Sandage, A. 1981, Astron. J., 86, 1870.
Smith, H.A., Wesselink, A.J. 1977, Astron. Astrophys., 56, 135.
Sweigart, A.V., Renzini, A. 1979, Astron. Astrophys., 71, 66.
Szeidl, B. 1965, Mitt. Sternw. ung. Akad. Wiss., Budapest-Szabads·ghegy, No. 58.CoKon 58
MODEL OF FLUCTUATION OF PERIOD IN MULTIPLE PERIODIC VARIABLES M. Marik Department of Astronomy Eˆtvˆs Lor·nd University, Budapest, Hungary Let us suppose that the primary period of light variation (Pi) is associated with the pulsation, and the secondary period (P) with the rotation of the star. The radius (R) of the star is: R = R_0(1 + A*cos 2*pi*t/Pi) (1) where R_0 is the mean radius, A is the amplitude of the pulsation and t is the time. The angular velocity (omega) of the rotation is: omega = N(k*M*R^2)^-1 (2) where N is the angular momentum, M the mass of the star and k is a constant of the order of magnitude 1. The mean angular velocity is: omega^dash = N(k*M*R_0^2)^-1*(1 - A^2)^-3/2 (3) Thus the period of rotation is P = P_0*(1 - A^2)^3/2 (4) where P_0 is the period of rotation for A = 0. Equation (4) means that if the amplitude of pulsation increases then the period of rotation decreases. Let us suppose that the kinetic energy of the pulsation is constant. In this case we get: A^2*Pi^-2 = constant and with Eq. (4): P = P_0*(1 - c*Pi^2) (5) Equation (5) enables us t_0 explain the reflection of the O-C curves of the primary and secondary periods of RR Lyrae stars in some cases (Detre, 1969). The angular displacement alpha(t) can be obtained from Eq. (2): alpha(t) = -P/Pi*sqrt(1-A^2)[(A sin(2pi/Pi)/(1+A cos(2pi/Pi)t) - - 2/(sqrt(1-A^2)) * arctg(sqrt(1-A^2)/(1+A) tg pi/Pi t)] (6) The fluctuations of angular displacement at moments t = P*i (i=0,1,2,3...) are: Delta alpha = 2*pi*i - alpha(P*i) (7) The time differences Delta t corresponding to Delta alpha are: Delta t = O - C = P/2*pi*alpha*(P*i) - P*i (8) If P/Pi is an irrational number, we can get for the standard deviation of the secondary period: sigma_s^2 = A^2*pi^-1*Pi^2 (9) or with Eq. (4): sigma_s = Pi*pi^-1*sqrt(1 - P/P_0^(2/3)) Equation (10) means that sigma_s is proportional to Pi and decreases with increasing P. Our results are not in contradiction with the observations, but we have insufficient observations to assess the validity of our model (Marik, 1976). References: Detre, L. 1969, Non-periodic Phenomena in Variable Stars, AkadÈmiai KiadÛ, Budapest, p. 3. Marik, M. 1976, Az Eˆtvˆs Lor·nd Tudom·nyegyetem KˆzlemÈnyei, No. 3.
PULSATION MODES AND PHOTOMETRIC MASSES OF CEPHEID VARIABLES
A. Opolski
Wroclaw University Observatory
Wroclaw, Poland
Abstract
On the basis of the Wesselink radii and colour indices <B-V>_0 the relation
P_F - R - <B-V>_0, for fundamental periods P_F was established. This enabled separation of
the first overtone pulsators: BG Cru, BF Oph, V 482 Sco, Y Sgr and U Aql. Transformation to
the P_F - M_
STANDSTILL OF SOME delta SCUTI STARS
B. Vetı
Institut for General Physics, Eˆtvˆs Lor·nd University
H-1088, Budapest, Muzeum krt. 6-8.
Hungary
There are a number of interesting variable stars which have been classified as delta
Scuti variables on the basis of their amplitudes, periods and spectral type. Further
observations suggested that these stars do not always show light variation. The contradictory
observations on their variability have meant that these stars cannot be regarded as normal
delta Scuti variables. The four best known of them show a great deal of similarity.
tau Cygni (HR 8130). Light variations of 0.02 in yellow were announced by Pande
(1960). Breger (1969) reported that this star did not vary. The last observations by Fesen
(1973) during two nights in August 1972 indicated tau Cyg to be constant.
tau Pegasi (HR 8880). Breger (1969) found this star to be constant over four hours,
but Millis and Thompson (1970) discovered a variation with a period of 80 minutes and an
amplitude of 0.02. Fesen (1973) has confirmed this variability. He determined the period
and the amplitude from observations of two consecutive nights. These values were found to
be 82.5 minutes and 0.015 on the first and 0.025 on the second night, and they were in good
agreement with Millis' observations.
gamma Bootis (HR 5435). Old measurements indicated a variability with a period of
0.29 (Miczaika, 1952). Other observations showed no signs of variability (Millis, 1967).
Sareyan et al. (1971) confirmed the old period and phase.
gamma Coronae Borealis (HR 5849) is the most observed star of the four. It was
classified as a delta Scuti star by Fernie (1969). Tippets and Wilcken (1970) reobserved
the star and found no light variations during two nights. In the same year Percy (1970)
examined the star and reported some variability with poorly defined period (about 0.03). We
have investigated this star (Vetı and Kov·cs, 1981) to determine the period of its light
variation. The observations were made on four nights in May 1981. The star showed some
signs of variations on one night only and on the other three nights it was constant.
The light curve on J.D. 2444706 is very similar to Percy's observations in yellow.
We calculated the power spectrum for all our data to determine the period of
gamma CrB and found a well separated peak at the frequency - similar to Percy - of 23.6 c/d,
with an amplitude about 0.001.
The radial velocity measurements on these stars suggested that the light variation
is caused by pulsation. The dependence of the periods on the radius confirms it. These stars
vary after a standstill with the old period. In the case of gamma CrB we could find this
period during the standstill but with an amplitude of less than 0.001m only.
Unfortunately, the standstills of these stars can hardly be explained by a strong
beat phenomenon because these standstills are too long. The similarity between these stars
and the short periodic variability of Ap stars is easily apparent.
References:
Baglin, A., Breger, M., Chevalier, C., Hauck, B., leContel, J.M., Sareyan,
J.P., Valtier, J.C. 1973, Astron. Astrophys., 23, 221.
Breger, M. 1969, Pub. A.S.P., 84, 443.
Breger, M. 1979, Pub. A.S.P., 91, 5.
Fernie, J.D. 1969, J.R.A.S. Canada, 63, 133.
Fesen, R.A. 1973, Pub. A.S.P., 85, 732.
Miczaika, G.R. 1952, Z. Astrophys., 30, 134.
Millis, R.L. 1967, Pub. A.S.P., 79, 272.
Millis, R.L., Thompson, D.T. 1970, Pub. A.S.P., 82, 352.
Panda, M. 1960, The Observatory, 80, 225.
Percy, J.R. 1970, Pub. A.S.P., 82,126.
Sareyan, J.P., Zribi, G., Bijaoui, A. 1971, Inf. Bull. var. Stars, No. 531. IBVS 531
Tippets, R., Wilcken, S.K. 1970, Pub. A.S.P., 82, 1156.
Vetı, B., Kov·cs, G. 1981, Inf. Bull. var. Stars, No. 2030. IBVS 2030
 Figure 1. Frequency distribution of Delta log P for groups of stars with <B-V>_0
smaller and larger than 0.85 . The separation of fundamental F and first overtone
pulsators is shown.
Taking into consideration the estimated accuracy of the Wesselink radii, viz. 10% or
log R ± 0.04 , and the accuracy of <B-V>_0 , viz. ±0.05 , the maximum error due to these
factors amounts to ±0.07 . The scatter of Delta log P visible in Fig. 1 up to ±0.10 for
log P_F can be regarded as evidence that there is also a natural scatter of the
investigated parameters in relation to formula (5a).
The frequency distribution of Delta log P for the second group <B-V> > 0.85
indicates a complete homogeneity with small dispersion -0.08< Delta log P < +0.04 .
In Fig. 2 the Delta log P values are plotted as a function of log P. For comparison
the 11 double-mode Cepheids according to their log P_F and Delta log P = log P_H - log P_F
values are shown as a line with open circles from TU Cas (log P_F= 0.330) to V 367 Sct
(log P_F = 0.799) (Stobie, 1977). Also a theoretical line, Cox and Hodson (1978), is added.
This comparison makes it possible to conclude that the values of log P for 5 stars
identified as the first overtone pulsators
Figure 1. Frequency distribution of Delta log P for groups of stars with <B-V>_0
smaller and larger than 0.85 . The separation of fundamental F and first overtone
pulsators is shown.
Taking into consideration the estimated accuracy of the Wesselink radii, viz. 10% or
log R ± 0.04 , and the accuracy of <B-V>_0 , viz. ±0.05 , the maximum error due to these
factors amounts to ±0.07 . The scatter of Delta log P visible in Fig. 1 up to ±0.10 for
log P_F can be regarded as evidence that there is also a natural scatter of the
investigated parameters in relation to formula (5a).
The frequency distribution of Delta log P for the second group <B-V> > 0.85
indicates a complete homogeneity with small dispersion -0.08< Delta log P < +0.04 .
In Fig. 2 the Delta log P values are plotted as a function of log P. For comparison
the 11 double-mode Cepheids according to their log P_F and Delta log P = log P_H - log P_F
values are shown as a line with open circles from TU Cas (log P_F= 0.330) to V 367 Sct
(log P_F = 0.799) (Stobie, 1977). Also a theoretical line, Cox and Hodson (1978), is added.
This comparison makes it possible to conclude that the values of log P for 5 stars
identified as the first overtone pulsators
 Figure 2. Delta log P - log P relation. The typical fundamental pulsators are indicated by
small crosses (x) the remaining by points. The positions of 5 first overtone pulsators
(BG Cru, BF Oph, V 482 Sco, Y Sgr and U Aql) are marked by + signs placed at about
Delta log P = -0.15 . In this region the line with open circles at the ends represents the
double-mode Cepheids. The theoretical line (Cox and Hodson, 1978) is also shown.
are in accordance with other data and that all first overtone pulsators, single and
double-mode Cepheids, occur in the similar ranges of periods, viz. 0.3 < log P < 0.9 . This
last conclusion is the reason we assume that 13 long period Cepheids of the second group
are fundamental pulsators.
According to these results the stars in Table II are designated as fundamental F or
first overtone H pulsators.
We may call attention to the fact that in our investigation the star SU Cas appears
as a fundamental pulsator. This has been frequently regarded as doubtful, see Cox (1979).
Moreover, S Mus, with the largest positive value of Delta log P = +0.12, is an unusual
Cepheid and will be discussed in the last part of this paper.
The transformation of the above equations to the commonly used P-L-C relation is
possible by replacing <B-V>_0 by the surface brightness in the V band, S_V , and by
calculating the absolute magnitudes M_V
M_<V> = -5 log R_max + S_V (7)
This definition means that we assume as the representative state of the pulsating star the
mean part of the descending branch of the light curve, when the radius passes through a
flat maximum, the temperature is slowly decreasing and the photosphere is moving with a
constant, downward acceleration. With the help of the next equation:
M_bol = -5*log R_max - 10*log T_e + 42.312 (8)
we have
S_V = 42.312 - 10.2 log T_e - B.C. (9)
where
B.C. = M_bol - M_<V>
In other papers instead of S_V the surface brightness parameter, F_V is used:
F_V = log T_e + 0.1 - B.C. (10)
and therefore
S_V= 42.312 - 10*F_V (11)
According to Barnes (1980) the parameter F_V is related to the colour index (V-R)_0:
F_V = 3.957 - 0.360*(V-R)_0 (12)
This result is achieved by assuming that the slope
(Delta F_V)/(Delta (V-R)) = -0.360
derived from the pulsational changes of individual stars is valid also for the mean values
of F_V and (V-R)_0 for all Cepheids. The zero point of equation (12) was adopted from the
model atmosphere results. Replacing F_V by S_V
Table III
<B-V>_0 - S_V - log T_e relation
<B-V>_0 (V-R)_0 S_V B.C. log T_e
0.10 0.11 3.14 0.00 3.917
0.20 0.22 3.53 + .13 .865
0.30 0.30 3.82 + .14 .835
0.40 0.37 4.07 + .11 .813
0.50 0.42 4.25 + .08 .798
0.60 0.47 4.43 + .04 .784
0.70 0.51 4.58 - .01 .774
0.80 0.56 4.76 - .07 .762
0.90 0.60 4.90 - .12 .749
1.00 0.66 5.12 - .19 .735
1.10 0.74 5.41 - .27 .717
1.20 0.81 5.66 - .37 .702
1.30 0.88 5.91 - .46 .686
1.40 0.96 6.20 - .60 .671
1.50 1.05 6.52 -0.75 3.654
we have:
S_V = 2.742 +3.60 - (V-R)_0 (13)
The next step is the transformation of (V-R)_0 to <B-V>_0 , which has been done
with the aid of the results achieved for supergiants I by Johnson (1966). When we added the
B.C. - <B-V>_0 relation of Flower (1977) we got the complete set of data used in this
investigation (Table III). The numerical quantities of this table can be approximated by
the formulae:
for 0.4< <B-V> _0 <0.9
S_V = 3.41 + 1.660*<B-V>_0 (14)
log T_e = 3.858 - 0.120*<B-V>_0
for 0.9< <B-V>_0 <1.2
S_V = 2.62 + 2.533*<B-V>_0 (15)
log T_e = 3.892 - 0.158*<B-V>_0
The S_V - <B-V>_0 relation can be tested by means of 6 calibration Cepheids, which
are to be found in Table II and for which the M values were taken from van den Bergh (1977)
and from Sandage and Tammann (1969) and corrected by -0.26 according to the new distance
scale (Cox, 1979). For these stars the values of S_V result directly from formula (7),
Table IV. In Fig. 3 we see that the individual points are scattered on both sides of the
relation established above. The greatest deviation corresponds to SU Cas, Delta S_V = -0.55,
whereas for other stars Delta S_V is about ±0.25 . But SU Cas and RS Pup were not used by
van den Bergh as they are unreliable.
Now it is possible to replace tog R_max in formulae (5) and (6) by M_<V> and <B-V>_0
with the aid of equations (7) and (14) or (15) to get the P-L-C relations:
for 0.4 < <B-V>_0 < 0.9
log P_F = -0.777 - 0.2367*M_<V> + 0.953*<B-V>_0 (16a)
Delta log P = log P + 0.777 + 0.2367*M_<V> 0.953*<B-V>_0 (16b)
for 0.9 < <B-V>_0 < 1.2
log P_F = -0.842 - 0.222*M_<V> +1.032*<B-V>_0 (17a)
Delta log P = log P + 0.842 + 0.222*M_<V> - 1.032 - <B-V>_0 (17b)
With the aid of these formulae it is easy to calculate Delta log P for the
calibration of the Cepheids used by van den Bergh (1977) with the addition SZ Cas, RS Pup
and S Vul. Colour indices are accepted as for other stars but
Table IV
Surface brightness for 6 calibration Cepheids
log P_F <B-V>_0 M_<V> log R_max S_V
U Sgr 0.829 0.57 -4.19 1.782 +4.72
S Nor 0.989 0.75 -4.29 1.756 +4.49
T Mon 1.432 0.98 -5.76 2.122 +4.85
SV Vul 1.654 1.08 -6.26 2.282 +5.15
SU Cas 0.290 0.48 -3.07 1.346 +3.66
RS Pup 1.617 0.98 -6.33 2.347 +5.40
Table IVb Calibration Cepheids
log P_F <B-V>_0 M_<V> Delta log P
EV Sct 0.490 0.55 -2.88 +0.061
CEb Cas 0.651 .59 -3.46 .047
CF Cas 0.688 .68 -3.34 .026
CEa Cas 0.711 .66 -3.54 .021
CV Mon 0.731 .62 -3.61 .063
CS Vel 0.771 .68 ? -3.31 .117
V367 Sct 0.799 .51 ? -4.08 .124
U Sgr 0.829 .57 -4.19 .071
DL Cas 0.903 .71 -4.10 .034
S Nor 0.989 .75 -4.29 .036
TW Nor 1.033 .82 ? -3.79 .132
SZ Cas 1.134 0.66 -5.06 +0.084
mean +0.063
VY Car 1.277 0.94 ? -5.23 +0.006
T Mon 1.432 0.98 -5.76 .002
RS Pup 1.617 0.98 -6.33 .061
SV Vul 1.654 1.08 -6.26 .017
S Vul 1.826 1.05 -6.89 +0.074
mean +0.032
Figure 2. Delta log P - log P relation. The typical fundamental pulsators are indicated by
small crosses (x) the remaining by points. The positions of 5 first overtone pulsators
(BG Cru, BF Oph, V 482 Sco, Y Sgr and U Aql) are marked by + signs placed at about
Delta log P = -0.15 . In this region the line with open circles at the ends represents the
double-mode Cepheids. The theoretical line (Cox and Hodson, 1978) is also shown.
are in accordance with other data and that all first overtone pulsators, single and
double-mode Cepheids, occur in the similar ranges of periods, viz. 0.3 < log P < 0.9 . This
last conclusion is the reason we assume that 13 long period Cepheids of the second group
are fundamental pulsators.
According to these results the stars in Table II are designated as fundamental F or
first overtone H pulsators.
We may call attention to the fact that in our investigation the star SU Cas appears
as a fundamental pulsator. This has been frequently regarded as doubtful, see Cox (1979).
Moreover, S Mus, with the largest positive value of Delta log P = +0.12, is an unusual
Cepheid and will be discussed in the last part of this paper.
The transformation of the above equations to the commonly used P-L-C relation is
possible by replacing <B-V>_0 by the surface brightness in the V band, S_V , and by
calculating the absolute magnitudes M_V
M_<V> = -5 log R_max + S_V (7)
This definition means that we assume as the representative state of the pulsating star the
mean part of the descending branch of the light curve, when the radius passes through a
flat maximum, the temperature is slowly decreasing and the photosphere is moving with a
constant, downward acceleration. With the help of the next equation:
M_bol = -5*log R_max - 10*log T_e + 42.312 (8)
we have
S_V = 42.312 - 10.2 log T_e - B.C. (9)
where
B.C. = M_bol - M_<V>
In other papers instead of S_V the surface brightness parameter, F_V is used:
F_V = log T_e + 0.1 - B.C. (10)
and therefore
S_V= 42.312 - 10*F_V (11)
According to Barnes (1980) the parameter F_V is related to the colour index (V-R)_0:
F_V = 3.957 - 0.360*(V-R)_0 (12)
This result is achieved by assuming that the slope
(Delta F_V)/(Delta (V-R)) = -0.360
derived from the pulsational changes of individual stars is valid also for the mean values
of F_V and (V-R)_0 for all Cepheids. The zero point of equation (12) was adopted from the
model atmosphere results. Replacing F_V by S_V
Table III
<B-V>_0 - S_V - log T_e relation
<B-V>_0 (V-R)_0 S_V B.C. log T_e
0.10 0.11 3.14 0.00 3.917
0.20 0.22 3.53 + .13 .865
0.30 0.30 3.82 + .14 .835
0.40 0.37 4.07 + .11 .813
0.50 0.42 4.25 + .08 .798
0.60 0.47 4.43 + .04 .784
0.70 0.51 4.58 - .01 .774
0.80 0.56 4.76 - .07 .762
0.90 0.60 4.90 - .12 .749
1.00 0.66 5.12 - .19 .735
1.10 0.74 5.41 - .27 .717
1.20 0.81 5.66 - .37 .702
1.30 0.88 5.91 - .46 .686
1.40 0.96 6.20 - .60 .671
1.50 1.05 6.52 -0.75 3.654
we have:
S_V = 2.742 +3.60 - (V-R)_0 (13)
The next step is the transformation of (V-R)_0 to <B-V>_0 , which has been done
with the aid of the results achieved for supergiants I by Johnson (1966). When we added the
B.C. - <B-V>_0 relation of Flower (1977) we got the complete set of data used in this
investigation (Table III). The numerical quantities of this table can be approximated by
the formulae:
for 0.4< <B-V> _0 <0.9
S_V = 3.41 + 1.660*<B-V>_0 (14)
log T_e = 3.858 - 0.120*<B-V>_0
for 0.9< <B-V>_0 <1.2
S_V = 2.62 + 2.533*<B-V>_0 (15)
log T_e = 3.892 - 0.158*<B-V>_0
The S_V - <B-V>_0 relation can be tested by means of 6 calibration Cepheids, which
are to be found in Table II and for which the M values were taken from van den Bergh (1977)
and from Sandage and Tammann (1969) and corrected by -0.26 according to the new distance
scale (Cox, 1979). For these stars the values of S_V result directly from formula (7),
Table IV. In Fig. 3 we see that the individual points are scattered on both sides of the
relation established above. The greatest deviation corresponds to SU Cas, Delta S_V = -0.55,
whereas for other stars Delta S_V is about ±0.25 . But SU Cas and RS Pup were not used by
van den Bergh as they are unreliable.
Now it is possible to replace tog R_max in formulae (5) and (6) by M_<V> and <B-V>_0
with the aid of equations (7) and (14) or (15) to get the P-L-C relations:
for 0.4 < <B-V>_0 < 0.9
log P_F = -0.777 - 0.2367*M_<V> + 0.953*<B-V>_0 (16a)
Delta log P = log P + 0.777 + 0.2367*M_<V> 0.953*<B-V>_0 (16b)
for 0.9 < <B-V>_0 < 1.2
log P_F = -0.842 - 0.222*M_<V> +1.032*<B-V>_0 (17a)
Delta log P = log P + 0.842 + 0.222*M_<V> - 1.032 - <B-V>_0 (17b)
With the aid of these formulae it is easy to calculate Delta log P for the
calibration of the Cepheids used by van den Bergh (1977) with the addition SZ Cas, RS Pup
and S Vul. Colour indices are accepted as for other stars but
Table IV
Surface brightness for 6 calibration Cepheids
log P_F <B-V>_0 M_<V> log R_max S_V
U Sgr 0.829 0.57 -4.19 1.782 +4.72
S Nor 0.989 0.75 -4.29 1.756 +4.49
T Mon 1.432 0.98 -5.76 2.122 +4.85
SV Vul 1.654 1.08 -6.26 2.282 +5.15
SU Cas 0.290 0.48 -3.07 1.346 +3.66
RS Pup 1.617 0.98 -6.33 2.347 +5.40
Table IVb Calibration Cepheids
log P_F <B-V>_0 M_<V> Delta log P
EV Sct 0.490 0.55 -2.88 +0.061
CEb Cas 0.651 .59 -3.46 .047
CF Cas 0.688 .68 -3.34 .026
CEa Cas 0.711 .66 -3.54 .021
CV Mon 0.731 .62 -3.61 .063
CS Vel 0.771 .68 ? -3.31 .117
V367 Sct 0.799 .51 ? -4.08 .124
U Sgr 0.829 .57 -4.19 .071
DL Cas 0.903 .71 -4.10 .034
S Nor 0.989 .75 -4.29 .036
TW Nor 1.033 .82 ? -3.79 .132
SZ Cas 1.134 0.66 -5.06 +0.084
mean +0.063
VY Car 1.277 0.94 ? -5.23 +0.006
T Mon 1.432 0.98 -5.76 .002
RS Pup 1.617 0.98 -6.33 .061
SV Vul 1.654 1.08 -6.26 .017
S Vul 1.826 1.05 -6.89 +0.074
mean +0.032
 Figure 3. Surface brightness- colour index (S - <B-V>_0) relation. The positions of 6
calibration Cepheids with known Wesselink radii are marked by x. M_<V> has been diminished
by 0.26, see Cox (1979), Table IVb.
From the Delta log P values it is evident that all these stars are fundamental
pulsators. But there is a systematic difference Delta log P = +0.063 for 12 stars of the
first group and +0.032 for 5 stars of the second group. This may be removed, for example,
by correction of log R_max by about +0.06 or +0.03 respectively. That would bring 3
calibration stars: S Nor, T Mon and SV Vul nearer to the line representing the
S_V - <B-V>_0 relation, Fig. 3.
Photometric masses and problem of instability strip crossings
The problem of Cepheid masses is still far from a final solution. From the
discussion on this topic published by Cox (1979) it is evident that on the average
discrepancies between masses determined by various methods are removed. But there is still
a lack of relations between them and other parameters, e.g. mass-luminosity relation, which
should exist according to the theory. These facts encourage one to search for an
independent individual
mass determination and to verify the assumption that the observed Cepheids are all during
the second crossing of the instability strip - the longest crossing time. In connection
with this we may remark that according to the results of Becker et al. (1977) for certain
masses and chemical compositions the lifetimes for the third crossing are longer than for
the second one. So it seems worth trying to sort the Cepheids according to their crossings
of the instability strip.
The possibility for such a test exists because of the results published by Pel
(1978). On the basis of two colour indices of Walraven photometry he succeeded in
establishing the effective gravity, g_e, for all the phases of 60 Cepheids. From his
diagrams we estimated the values of log g_e for the phase of maximum radius R_max. The
accuracy of this procedure is about +-0.05, Table V. The actual gravity, g, and effective
gravity, g_e , are connected with each other:
g = g_e - r^.. (18)
As the pulsation acceleration, r^.., we assume the value also for the phase of R_max. This
may easily be estimated from the slope of the velocity curve, v_r, which in most cases is
constant over the range of phases O.3-0.6, when the radius reaches its maximum value. The
pulsation acceleration is equal to:
r^.. = -p *dV_r/dt ; p = 1.31
The gravity g so derived is used to calculate the "photometric masses", M_ph:
g = g_sun*(M_ph/R_max^2)
where solar gravity g_sun = 2.74.10^4 cm*sec^-2, or
log M_ph = log g + 2*log R_max - 4.438 (19)
The photometric masses resulting from this relation should be related to the luminosities
and effective temperatures. These two parameters have been replaced by the quantities M_<V>
and <B-V>_0 taken from Table II.
To begin with we start with the group of 29 stars for which the complete set of
three observational data has been derived: log M_ph , M_<V> and <B-V>_0 Table V. We assume
the relation
log M_ph = a + b*M_<V> + c*<B-V>_0 , (20)
where the values a, b and c are to be calculated by the least squares method. We then
proceed similarly to when selecting the first overtone pulsators.
We check the homogeneity of this group by investigating the frequency distribution of the
quantity
Delta log M_ph = log M_ph - a - b*M_<V> - c*<B-V>_0 (21)
The solution of equation (20) for all 29 stars gives a large standard deviation, viz.
s.d. = +-0.18 . But it was possible to select from this group 15 stars which satisfy the
equation:
log M_ph2 - 0.042 - 0.354*M_<V> - 0.884*<B-V>_0 (22a)
with s.d.= 0.046 . For these stars the values
Delta log M_ph = log M_ph2 - 0.042 + 0.354*M_<V> + 0.884*<B-V>_0 (22b)
are in the range -0.08 < Delta log M_ph < 0.12 . For the other 10 stars of the same group
the log M_Ph values are clustered near -0.17 , from -0.32 to -0.12 . In this way equation
(22b) became the basis for dividing the 25 stars into two groups. This can be seen from
Fig. 4, where the frequency distribution of Delta log M_ph is displayed. Taking into
account the passages of the evolutionary tracks of Cepheids across the instability strip,
we suggest that these two groups include stars in the second and third crossing of the
instability strip and that relation (22a) is valid for the second crossing log M_ph2.
Consequently, the remaining 4 stars may be classified as being in the first and fourth
crossings, with 1 star added to the second crossing stars. As the limiting Delta log M_ph
values we accepted:
crossing Delta log M_ph
number
max. min.
1 +0.38 +0.14
2 +0.14 -0.09
3 -0.09 -0.34
4 -0.34 -0.64
Figure 3. Surface brightness- colour index (S - <B-V>_0) relation. The positions of 6
calibration Cepheids with known Wesselink radii are marked by x. M_<V> has been diminished
by 0.26, see Cox (1979), Table IVb.
From the Delta log P values it is evident that all these stars are fundamental
pulsators. But there is a systematic difference Delta log P = +0.063 for 12 stars of the
first group and +0.032 for 5 stars of the second group. This may be removed, for example,
by correction of log R_max by about +0.06 or +0.03 respectively. That would bring 3
calibration stars: S Nor, T Mon and SV Vul nearer to the line representing the
S_V - <B-V>_0 relation, Fig. 3.
Photometric masses and problem of instability strip crossings
The problem of Cepheid masses is still far from a final solution. From the
discussion on this topic published by Cox (1979) it is evident that on the average
discrepancies between masses determined by various methods are removed. But there is still
a lack of relations between them and other parameters, e.g. mass-luminosity relation, which
should exist according to the theory. These facts encourage one to search for an
independent individual
mass determination and to verify the assumption that the observed Cepheids are all during
the second crossing of the instability strip - the longest crossing time. In connection
with this we may remark that according to the results of Becker et al. (1977) for certain
masses and chemical compositions the lifetimes for the third crossing are longer than for
the second one. So it seems worth trying to sort the Cepheids according to their crossings
of the instability strip.
The possibility for such a test exists because of the results published by Pel
(1978). On the basis of two colour indices of Walraven photometry he succeeded in
establishing the effective gravity, g_e, for all the phases of 60 Cepheids. From his
diagrams we estimated the values of log g_e for the phase of maximum radius R_max. The
accuracy of this procedure is about +-0.05, Table V. The actual gravity, g, and effective
gravity, g_e , are connected with each other:
g = g_e - r^.. (18)
As the pulsation acceleration, r^.., we assume the value also for the phase of R_max. This
may easily be estimated from the slope of the velocity curve, v_r, which in most cases is
constant over the range of phases O.3-0.6, when the radius reaches its maximum value. The
pulsation acceleration is equal to:
r^.. = -p *dV_r/dt ; p = 1.31
The gravity g so derived is used to calculate the "photometric masses", M_ph:
g = g_sun*(M_ph/R_max^2)
where solar gravity g_sun = 2.74.10^4 cm*sec^-2, or
log M_ph = log g + 2*log R_max - 4.438 (19)
The photometric masses resulting from this relation should be related to the luminosities
and effective temperatures. These two parameters have been replaced by the quantities M_<V>
and <B-V>_0 taken from Table II.
To begin with we start with the group of 29 stars for which the complete set of
three observational data has been derived: log M_ph , M_<V> and <B-V>_0 Table V. We assume
the relation
log M_ph = a + b*M_<V> + c*<B-V>_0 , (20)
where the values a, b and c are to be calculated by the least squares method. We then
proceed similarly to when selecting the first overtone pulsators.
We check the homogeneity of this group by investigating the frequency distribution of the
quantity
Delta log M_ph = log M_ph - a - b*M_<V> - c*<B-V>_0 (21)
The solution of equation (20) for all 29 stars gives a large standard deviation, viz.
s.d. = +-0.18 . But it was possible to select from this group 15 stars which satisfy the
equation:
log M_ph2 - 0.042 - 0.354*M_<V> - 0.884*<B-V>_0 (22a)
with s.d.= 0.046 . For these stars the values
Delta log M_ph = log M_ph2 - 0.042 + 0.354*M_<V> + 0.884*<B-V>_0 (22b)
are in the range -0.08 < Delta log M_ph < 0.12 . For the other 10 stars of the same group
the log M_Ph values are clustered near -0.17 , from -0.32 to -0.12 . In this way equation
(22b) became the basis for dividing the 25 stars into two groups. This can be seen from
Fig. 4, where the frequency distribution of Delta log M_ph is displayed. Taking into
account the passages of the evolutionary tracks of Cepheids across the instability strip,
we suggest that these two groups include stars in the second and third crossing of the
instability strip and that relation (22a) is valid for the second crossing log M_ph2.
Consequently, the remaining 4 stars may be classified as being in the first and fourth
crossings, with 1 star added to the second crossing stars. As the limiting Delta log M_ph
values we accepted:
crossing Delta log M_ph
number
max. min.
1 +0.38 +0.14
2 +0.14 -0.09
3 -0.09 -0.34
4 -0.34 -0.64
 Figure 4. Frequency distribution of Delta log M_ph for 29 stars. The separation of stars
being in different crossings is indicated.
In order to increase the number of investigated stars we established the
Table V
Crossing Numbers and Photometric Masses of Cepheid Variables
log P Mode& <B-V>_0 log R_max log g_eq log g_e r^.. log g log M_ph Delta log M_ph M_<V> M_bol log T_e
cross
RT Mus 0.489 F2 0.50 1.518 2.62 2.12 -19.6 2.182 0.780 -0.004 -3,35 -3.27 3.798
AZ Cen .507 F3 .51 1.586 2.05 1.91 1.99 0.72 - .16 -3.67 -3.59 .796
UZ Cen .523 F,H2 2.28 2.08 2.14 -3.41 -3.36 .788
R TrA .530 F2 .57 1.554 2.25 2.05 -29.1 2.149 0.819 + .075
Y Car .561 F,H2 .61 1.53 2.40 2.18 2.22 0.54 - .10 -3.22 -3.19 .783
SS Sct .565 F37 2.01 1.83 1.92
AX Vel .565 F,H2 .56 1.564 2.47 2.29 2.33 0.680 - .106 -3.50 -3.44 .789
UX Car .566 F31 2.04 1.91 1.99
AG Cru .584 F3 .53 1.526 2.24 1.86 -22.9 1.982 0.596 - .159 -3.34 -3.27 .793
BF Oph .609 H2 .61 1.706 2.01 1.83 -27.0 1.973 0.947 - .009 -4.11 -4.07 .783
AH Vel .626 F4 .54 1.642 1.60 1.55 -10.4 1.663 0.509 - .435 -3.90 -3.83 .792
V Vel .641 F1 .56 1.598 2.90! 2.38 -19.1 2.413 1.171 + .334 -3.65 -3.59 .789
FF Aql .650 F4 .59 1.630 1.2O 1.15 -12.1 1.415 0.237 - .613 -3.76 -3.72 .785
V482 Sco .656 H3 .67 1.685 1.73 1.53 1.69 0.62 - .21 -3.90 -3.90 .776
T Vel .666 2 .63 1.589 2.07 1.92 -22.7 2.00 0.525 - .180 -3.49 -3.46 .781
RY CMa .670 F3 1.78 1.58 1.785
S Cru .671 F2 .61 1.606 1.99 1.85 1.94 0.71 - .06 -3.61 -3.58 .783
SX Car .687 2 .66 1.566 2.11 1.96 -10.5 2.03 0.260 - .374 -3.32 -3.31 .777
AP Sgr .704 F4 1.56 1.54 1.566
V381 Cen .706 2 .60 1.66 2.O3 1.93 2.01 0.90 + .02 -3.87 -3.83 .784
AP Pup .706 F2 .66 1.695 2.03 1.93 2.01 0.96 + .10 -3.97 -3.96 .777
V Cen .740 F2 .58 1.698 2.01 1.93 -14.7 2.000 0.958 - .028 -4.12 -4.07 .787
V419 Cen .741 F3 .60 1.667 1.67 1.62 1:75 0.65 - .26 -3.93 -3.89 .784
UY Car .744 2 2.02 1.92 1.99
GH Car .758 2 .70 1.763 1.91 1.83 1.92 0.76 - .16 -4.24 -4.25 .773
Y Sgr .761 H3 1.53 1.51 1.67
R Cru .765 F2 .63 1.682 1.92 1.82 -12.2 1.892 0.818 - .064 -3.95 -3.92 .781
RV Sco .783 F2 .63 1.636 1.97 1.89 -14.6 1.973 0.807 + .007 -3.72 -3.69 .781
FM Aql .786 1,2? 0.69 1.692 2.13 1.93 -11.6 2.00 0.636 - .184 -3.90 -3.90 3.774
X Cru 0.794 F3 1.57 1.57 1.690
Table V (cont.)
log P codes <B-V>_0 log R_max log g_eq log g_e r^.. log g log M_ph Delta log M_ph M_<V> M_bol log T_e
S TrA 0.801 F2 0.68 1.752 1.79 1.77 -12.6 1.857 0.923 - .010 -4.22 -4.22 3.775
BB Sgr .822 F2 .75 1.753 1.67 1.62 -17.7 1.778 0.846 + .014 -4.11 -4.15 .767
AT Pup .824 F2 .59 1.769 1.98 1.88 1.96 1.06 - .04 -4.46 -4.42 .785
V Car .826 F2 .68 1.717 1.91 1.81 -11.3 1.881 0.877 + .004 -4.05 -4.05 .775
T Cru .828 F2 .65 1.797 1.83 1.78 -14.1 1.869 1.025 - .033 -4.50 -4.48 .779
U Sgr .829 F2 .71 1.782 1.75 1.65 -12.4 1.758 0.884 - .060 -4.32 -4.34 .772
V 636 Sco .832 F3 .72 1.689 1.61 1.56 - 9.3 1.653 0.593 - .170 -3.84 -3.86 .771
v 496 Aql .833 F3 .78 1.726 1.56 1.51 - 7.0 1.591 0.605 - .134 -3.92 -3.98 .764
BG Vel .841 F1 .73 1.735 2.03 1.95 2.02 1.05 + .32 -4.05 -4.08 .770
X Sgr .846 F1 .53! 1.811 2.14 2.04 2.10 1.28 + .20 -4.76 -4.69 .793
U Aql .847 H3 .70 1.825 1.56 1.51 -14.2 1.663 0.875 - .159 -4.55 -4.56 .773
eta Aql .856 F3 .69 1.800 1.49 1.44 -12.4 1.602 0.764 - .245 -4.44 -4.44 .774
R Mus .876 F3 .65 1.737 1.66 1.58 1.72 0.76 - .20 -4.20 -4.22 .779
IT Car .877 2? .77 1.72 1.59 1.51 1.67 0.67 - .07 -3.92 -3.97 .765
RS Ori .879 2 1.60 1.55 1.70
W Sgr .880 F2 .65 1.79 1.82 1.77 1.87 1.01 - .05 -4.46 -4.44 .779
ER Car .888 F2 .75 1.691 1.80 1.70 1.81 0.75 + .03 -3.80 -3.84 .767
W Gem .899 3 .71 1.77 1.46 1.31 1.56 0.66 - .26 -4.26 -4.27 .772
S Sge .923 F3 .74 1.776 1.30 1.22 -17.1 1.531 0.645 - .243 -4.24 -4.36 .769
WX Pup .951 F2 .73 1.790 1.88 1.80 - 9.3 1.857 0.999 + .072 -4.33 .770
GH Lup .968 3,4? 1.18 1.13 1.46
V 500 Sco .969 3 1.48 1.28 1.54
FN Aql .977 3 .774 1.82 1.50 1.25 1.52 0.72 - .25 -4.47 -4.50 .769
SX Vel .980 3? .61! 1.89 1.63 1.53 1.69 1.03 - .25 -5.02 -4.99 .783
YZ Sgr .980 2 .75 1.82 1.61 1.56 1.71 0.91 - .04 -4.44 -4.48 .767
S Mus .985 F? .57! 1.797 2.82! 2.87! - 7.6! 2.875! 2.031! + .865! -4.63 -4.58 .788
S Nor .989 F2 .77 1.756 1.56 1.46 -19.0 1.681 0.755 - .052 -4.09 -4.14 .765
AQ Car .990 2 1.70 1.60 1.74
beta Dor 0.993 F2 .73 1.864 1.83 1.73 -15.6 1.845 1.135 + .077 -4.70 -4.73 .770
XX Cen 1.040 F3 0.71 1.801 1.43 1.28 -12.8 1.505 0.669 - .308 -4.42 -4.44 3.772
1.48 1.28 1.54
relation of the difference (log g - log g_e) to log g_e for the investigated group of 29
stars:
log g_e log g - log g_e
1.20 0.30
1.40 0.20
1.60 0.13
1.80 0.10
2.00 0.07
2.20 0.05
2.40 0.03
2.60 0.02
2.80 0.01
This relation was used to change log g_e to log g when it was not possible to get the V
value directly. Also, when <B-V>_0 was not known, but log R_max was determined, equation
(5a) was used to calculate the missing quantity. All these additional stars (Table V) have
log R_max log M_ph to only two decimal figures, whereas the basic 29 stars have three figures
in these quantities. This meant that it was possible to get, all in all, 47 values of
Delta log M_ph. For these stars the crossing numbers have been estimated and given in Table
V together with the designation of pulsation modes. For example, F2 means fundamental
pulsator in the second crossing. The dependence of Delta log M_ph on log M_ph can be seen
from Fig. 5.
Figure 4. Frequency distribution of Delta log M_ph for 29 stars. The separation of stars
being in different crossings is indicated.
In order to increase the number of investigated stars we established the
Table V
Crossing Numbers and Photometric Masses of Cepheid Variables
log P Mode& <B-V>_0 log R_max log g_eq log g_e r^.. log g log M_ph Delta log M_ph M_<V> M_bol log T_e
cross
RT Mus 0.489 F2 0.50 1.518 2.62 2.12 -19.6 2.182 0.780 -0.004 -3,35 -3.27 3.798
AZ Cen .507 F3 .51 1.586 2.05 1.91 1.99 0.72 - .16 -3.67 -3.59 .796
UZ Cen .523 F,H2 2.28 2.08 2.14 -3.41 -3.36 .788
R TrA .530 F2 .57 1.554 2.25 2.05 -29.1 2.149 0.819 + .075
Y Car .561 F,H2 .61 1.53 2.40 2.18 2.22 0.54 - .10 -3.22 -3.19 .783
SS Sct .565 F37 2.01 1.83 1.92
AX Vel .565 F,H2 .56 1.564 2.47 2.29 2.33 0.680 - .106 -3.50 -3.44 .789
UX Car .566 F31 2.04 1.91 1.99
AG Cru .584 F3 .53 1.526 2.24 1.86 -22.9 1.982 0.596 - .159 -3.34 -3.27 .793
BF Oph .609 H2 .61 1.706 2.01 1.83 -27.0 1.973 0.947 - .009 -4.11 -4.07 .783
AH Vel .626 F4 .54 1.642 1.60 1.55 -10.4 1.663 0.509 - .435 -3.90 -3.83 .792
V Vel .641 F1 .56 1.598 2.90! 2.38 -19.1 2.413 1.171 + .334 -3.65 -3.59 .789
FF Aql .650 F4 .59 1.630 1.2O 1.15 -12.1 1.415 0.237 - .613 -3.76 -3.72 .785
V482 Sco .656 H3 .67 1.685 1.73 1.53 1.69 0.62 - .21 -3.90 -3.90 .776
T Vel .666 2 .63 1.589 2.07 1.92 -22.7 2.00 0.525 - .180 -3.49 -3.46 .781
RY CMa .670 F3 1.78 1.58 1.785
S Cru .671 F2 .61 1.606 1.99 1.85 1.94 0.71 - .06 -3.61 -3.58 .783
SX Car .687 2 .66 1.566 2.11 1.96 -10.5 2.03 0.260 - .374 -3.32 -3.31 .777
AP Sgr .704 F4 1.56 1.54 1.566
V381 Cen .706 2 .60 1.66 2.O3 1.93 2.01 0.90 + .02 -3.87 -3.83 .784
AP Pup .706 F2 .66 1.695 2.03 1.93 2.01 0.96 + .10 -3.97 -3.96 .777
V Cen .740 F2 .58 1.698 2.01 1.93 -14.7 2.000 0.958 - .028 -4.12 -4.07 .787
V419 Cen .741 F3 .60 1.667 1.67 1.62 1:75 0.65 - .26 -3.93 -3.89 .784
UY Car .744 2 2.02 1.92 1.99
GH Car .758 2 .70 1.763 1.91 1.83 1.92 0.76 - .16 -4.24 -4.25 .773
Y Sgr .761 H3 1.53 1.51 1.67
R Cru .765 F2 .63 1.682 1.92 1.82 -12.2 1.892 0.818 - .064 -3.95 -3.92 .781
RV Sco .783 F2 .63 1.636 1.97 1.89 -14.6 1.973 0.807 + .007 -3.72 -3.69 .781
FM Aql .786 1,2? 0.69 1.692 2.13 1.93 -11.6 2.00 0.636 - .184 -3.90 -3.90 3.774
X Cru 0.794 F3 1.57 1.57 1.690
Table V (cont.)
log P codes <B-V>_0 log R_max log g_eq log g_e r^.. log g log M_ph Delta log M_ph M_<V> M_bol log T_e
S TrA 0.801 F2 0.68 1.752 1.79 1.77 -12.6 1.857 0.923 - .010 -4.22 -4.22 3.775
BB Sgr .822 F2 .75 1.753 1.67 1.62 -17.7 1.778 0.846 + .014 -4.11 -4.15 .767
AT Pup .824 F2 .59 1.769 1.98 1.88 1.96 1.06 - .04 -4.46 -4.42 .785
V Car .826 F2 .68 1.717 1.91 1.81 -11.3 1.881 0.877 + .004 -4.05 -4.05 .775
T Cru .828 F2 .65 1.797 1.83 1.78 -14.1 1.869 1.025 - .033 -4.50 -4.48 .779
U Sgr .829 F2 .71 1.782 1.75 1.65 -12.4 1.758 0.884 - .060 -4.32 -4.34 .772
V 636 Sco .832 F3 .72 1.689 1.61 1.56 - 9.3 1.653 0.593 - .170 -3.84 -3.86 .771
v 496 Aql .833 F3 .78 1.726 1.56 1.51 - 7.0 1.591 0.605 - .134 -3.92 -3.98 .764
BG Vel .841 F1 .73 1.735 2.03 1.95 2.02 1.05 + .32 -4.05 -4.08 .770
X Sgr .846 F1 .53! 1.811 2.14 2.04 2.10 1.28 + .20 -4.76 -4.69 .793
U Aql .847 H3 .70 1.825 1.56 1.51 -14.2 1.663 0.875 - .159 -4.55 -4.56 .773
eta Aql .856 F3 .69 1.800 1.49 1.44 -12.4 1.602 0.764 - .245 -4.44 -4.44 .774
R Mus .876 F3 .65 1.737 1.66 1.58 1.72 0.76 - .20 -4.20 -4.22 .779
IT Car .877 2? .77 1.72 1.59 1.51 1.67 0.67 - .07 -3.92 -3.97 .765
RS Ori .879 2 1.60 1.55 1.70
W Sgr .880 F2 .65 1.79 1.82 1.77 1.87 1.01 - .05 -4.46 -4.44 .779
ER Car .888 F2 .75 1.691 1.80 1.70 1.81 0.75 + .03 -3.80 -3.84 .767
W Gem .899 3 .71 1.77 1.46 1.31 1.56 0.66 - .26 -4.26 -4.27 .772
S Sge .923 F3 .74 1.776 1.30 1.22 -17.1 1.531 0.645 - .243 -4.24 -4.36 .769
WX Pup .951 F2 .73 1.790 1.88 1.80 - 9.3 1.857 0.999 + .072 -4.33 .770
GH Lup .968 3,4? 1.18 1.13 1.46
V 500 Sco .969 3 1.48 1.28 1.54
FN Aql .977 3 .774 1.82 1.50 1.25 1.52 0.72 - .25 -4.47 -4.50 .769
SX Vel .980 3? .61! 1.89 1.63 1.53 1.69 1.03 - .25 -5.02 -4.99 .783
YZ Sgr .980 2 .75 1.82 1.61 1.56 1.71 0.91 - .04 -4.44 -4.48 .767
S Mus .985 F? .57! 1.797 2.82! 2.87! - 7.6! 2.875! 2.031! + .865! -4.63 -4.58 .788
S Nor .989 F2 .77 1.756 1.56 1.46 -19.0 1.681 0.755 - .052 -4.09 -4.14 .765
AQ Car .990 2 1.70 1.60 1.74
beta Dor 0.993 F2 .73 1.864 1.83 1.73 -15.6 1.845 1.135 + .077 -4.70 -4.73 .770
XX Cen 1.040 F3 0.71 1.801 1.43 1.28 -12.8 1.505 0.669 - .308 -4.42 -4.44 3.772
1.48 1.28 1.54
relation of the difference (log g - log g_e) to log g_e for the investigated group of 29
stars:
log g_e log g - log g_e
1.20 0.30
1.40 0.20
1.60 0.13
1.80 0.10
2.00 0.07
2.20 0.05
2.40 0.03
2.60 0.02
2.80 0.01
This relation was used to change log g_e to log g when it was not possible to get the V
value directly. Also, when <B-V>_0 was not known, but log R_max was determined, equation
(5a) was used to calculate the missing quantity. All these additional stars (Table V) have
log R_max log M_ph to only two decimal figures, whereas the basic 29 stars have three figures
in these quantities. This meant that it was possible to get, all in all, 47 values of
Delta log M_ph. For these stars the crossing numbers have been estimated and given in Table
V together with the designation of pulsation modes. For example, F2 means fundamental
pulsator in the second crossing. The dependence of Delta log M_ph on log M_ph can be seen
from Fig. 5.
 Figure 5. Delta log M_ph- log M_ph relation with division on crossings
1, 2, 3 and 4. The limiting values of Delta log M_ph are shown. The stars
in different crossings are denoted by the symbols which are also used in
the all next Figures.
The separation of these stars according to their crossing number may also
be shown otherwise. By eliminating log M_ph and M_<V> from formula (22a) with the aid of
equations (7), (14) and (16) we have for the second crossing:
log g + 1.4706*<B-V>_0 = 3.275 - 0.2325*log R_max (23)
We may then introduce log P_F instead of log R_max, (equation (5)), and we get the following
relation of three parameters:
2.9634 - log g = 1.3606*<B-V>_0 + 0.1964* log P_F (24)
In both these formulae g denotes, as before, the gravity for the phase of R_max . On account
of the small value of the coefficient by log P_F also log P_H may be used in formula (24),
causing an error of 0.03 . Therefore in practice this formula may be used with every period
P. The diagrams, Fig. 6 and Fig. 7, represent these two relations with the distinct
separation of stars being in different crossings.
When we use the mean values of log g_eq given by Pel (1978) and log P_F , then in
the diagram of Fig. 8 it is possible to indicate the regions where the stars of different
crossings are placed. So we may state that three double-mode Cepheids - UZ Cen, Y Car and
AX Vel - for which log g_eq was also determined by Pel (1978), are in the second crossing.
This diagram also allowed us to estimate the crossing numbers for the remaining stars, for
which only P and g_eq are known. In this way we were able to complete the determination of
the whole set of crossings amounting to 56 stars and 3 doubtful
cases:
crossing Delta log M_ph stars
min. mean max.
1 +0.14 +0.285 +0.38 3
2 -0.09 -0.005 +0.14 30
3 -0.34 -0.197 -0.09 20
4 -0.64 -0.474 -0.34 3
Figure 5. Delta log M_ph- log M_ph relation with division on crossings
1, 2, 3 and 4. The limiting values of Delta log M_ph are shown. The stars
in different crossings are denoted by the symbols which are also used in
the all next Figures.
The separation of these stars according to their crossing number may also
be shown otherwise. By eliminating log M_ph and M_<V> from formula (22a) with the aid of
equations (7), (14) and (16) we have for the second crossing:
log g + 1.4706*<B-V>_0 = 3.275 - 0.2325*log R_max (23)
We may then introduce log P_F instead of log R_max, (equation (5)), and we get the following
relation of three parameters:
2.9634 - log g = 1.3606*<B-V>_0 + 0.1964* log P_F (24)
In both these formulae g denotes, as before, the gravity for the phase of R_max . On account
of the small value of the coefficient by log P_F also log P_H may be used in formula (24),
causing an error of 0.03 . Therefore in practice this formula may be used with every period
P. The diagrams, Fig. 6 and Fig. 7, represent these two relations with the distinct
separation of stars being in different crossings.
When we use the mean values of log g_eq given by Pel (1978) and log P_F , then in
the diagram of Fig. 8 it is possible to indicate the regions where the stars of different
crossings are placed. So we may state that three double-mode Cepheids - UZ Cen, Y Car and
AX Vel - for which log g_eq was also determined by Pel (1978), are in the second crossing.
This diagram also allowed us to estimate the crossing numbers for the remaining stars, for
which only P and g_eq are known. In this way we were able to complete the determination of
the whole set of crossings amounting to 56 stars and 3 doubtful
cases:
crossing Delta log M_ph stars
min. mean max.
1 +0.14 +0.285 +0.38 3
2 -0.09 -0.005 +0.14 30
3 -0.34 -0.197 -0.09 20
4 -0.64 -0.474 -0.34 3
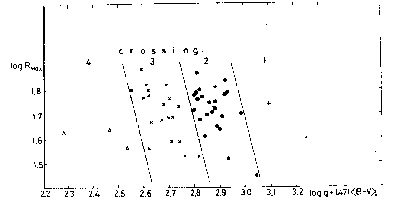 Figure 6. Separation of stars resulting from the formula (23) according
to different crossings. Notation of stars as in Fig. 5. Only one first
crossing star, X Sgr, is in the area of the second crossing stars.
Figure 6. Separation of stars resulting from the formula (23) according
to different crossings. Notation of stars as in Fig. 5. Only one first
crossing star, X Sgr, is in the area of the second crossing stars.
 Figure 7. Separation of stars resulting from the formula (24) according
to crossings. Notation of stars as in Fig. 5. X Sgr is in the area of
the second crossing stars, as in Fig. 6.
Figure 7. Separation of stars resulting from the formula (24) according
to crossings. Notation of stars as in Fig. 5. X Sgr is in the area of
the second crossing stars, as in Fig. 6.
 Figure 8. Stars in different crossings on the log g - log P plane. The
separation is not so complete as in Figs. 6 and 7, but it is possible to
indicate the limits between crossings sections.
As the direct consequences of these results we present the following relations:
1. Mass - fundamental period relation. Three first overtone pulsators are plotted
with periods increased by 0.15. Unexpectedly for all crossings the smallest masses seem to
occur near log P equals 0.675 (Fig. 9) though the separation of stars is not complete. For
example, three second crossing stars are in the area of the third crossing.
2. Mass - luminosity relation (Fig. 10). Here the separation of stars is satisfactory.
The relation indicates that the masses remain nearly constant up to M_bol = -4.1 and
increase for greater luminosities.
3. H - R diagram, M_bol - T_e relation (Fig. 11). The instability strip is well
marked with the complete mixing of stars with different crossings. Only S Mus and XX Vel
have too high temperatures.
4. Period - luminosity relation (Fig. 12) is quite normal. The width of the strip
is about 0.85m without separation of stars according to crossings. Here S Mus is in the
centre of the strip, but X Sgr is outstanding.
Unfortunately Pel's data do not include long period Cepheids so that it is not
possible to investigate the extension of these relations toward longer periods.
The star S Mus with normal P_F and M_bol has too high temperature and abnormally
large gravity and mass. This star should be investigated with special attention.
It would be desirable to have an independent confirmation of the above results.
Such a possibility may be offered by the secular changes of pulsation periods. From our
formulae we can conclude that the evolution of Cepheids along the lines of constant masses
should be accompanied by changes of their periods. During crossings 1, 3 and 5 - from the
blue to red edge of the instability strip - the period should increase. By contrast,
crossing numbers 2 and 4 should be accompanied by a decrease of the periods. The secular
changes of periods have been investigated by Szabados (1977, 1980). A distinct result was
obtained for eta Aql: the period is increasing, which agrees with crossing number 3, as
determined in the present paper.
Figure 8. Stars in different crossings on the log g - log P plane. The
separation is not so complete as in Figs. 6 and 7, but it is possible to
indicate the limits between crossings sections.
As the direct consequences of these results we present the following relations:
1. Mass - fundamental period relation. Three first overtone pulsators are plotted
with periods increased by 0.15. Unexpectedly for all crossings the smallest masses seem to
occur near log P equals 0.675 (Fig. 9) though the separation of stars is not complete. For
example, three second crossing stars are in the area of the third crossing.
2. Mass - luminosity relation (Fig. 10). Here the separation of stars is satisfactory.
The relation indicates that the masses remain nearly constant up to M_bol = -4.1 and
increase for greater luminosities.
3. H - R diagram, M_bol - T_e relation (Fig. 11). The instability strip is well
marked with the complete mixing of stars with different crossings. Only S Mus and XX Vel
have too high temperatures.
4. Period - luminosity relation (Fig. 12) is quite normal. The width of the strip
is about 0.85m without separation of stars according to crossings. Here S Mus is in the
centre of the strip, but X Sgr is outstanding.
Unfortunately Pel's data do not include long period Cepheids so that it is not
possible to investigate the extension of these relations toward longer periods.
The star S Mus with normal P_F and M_bol has too high temperature and abnormally
large gravity and mass. This star should be investigated with special attention.
It would be desirable to have an independent confirmation of the above results.
Such a possibility may be offered by the secular changes of pulsation periods. From our
formulae we can conclude that the evolution of Cepheids along the lines of constant masses
should be accompanied by changes of their periods. During crossings 1, 3 and 5 - from the
blue to red edge of the instability strip - the period should increase. By contrast,
crossing numbers 2 and 4 should be accompanied by a decrease of the periods. The secular
changes of periods have been investigated by Szabados (1977, 1980). A distinct result was
obtained for eta Aql: the period is increasing, which agrees with crossing number 3, as
determined in the present paper.
 Figure 9. Mass - fundamental period relation. Periods of first overtone
stars (BG Cru, BF Oph, V 482 Sco, Y Sgr, U Aql) are increased by 0.15.
Notation of stars as in Fig. 5. The smallest masses are near log P_F = 0.675 .
Figure 9. Mass - fundamental period relation. Periods of first overtone
stars (BG Cru, BF Oph, V 482 Sco, Y Sgr, U Aql) are increased by 0.15.
Notation of stars as in Fig. 5. The smallest masses are near log P_F = 0.675 .
 Figure 10. Mass - luminosity relation. In the range M_bol from -3.2 to -4.2
the masses seem to be constant. For greater luminosities the increase of
masses is visible.
Figure 10. Mass - luminosity relation. In the range M_bol from -3.2 to -4.2
the masses seem to be constant. For greater luminosities the increase of
masses is visible.
 Figure 11. Theoretical H-R diagram. The complete mixing of different
crossing stars in the instability strip is visible. Only S Mus and
SX Vel have too high temperatures. The positions of the first overtone
pulsators are indicated by H. Notation of stars as in Fig. 5.
Figure 11. Theoretical H-R diagram. The complete mixing of different
crossing stars in the instability strip is visible. Only S Mus and
SX Vel have too high temperatures. The positions of the first overtone
pulsators are indicated by H. Notation of stars as in Fig. 5.
 Figure 12. Luminosity - fundamental period relation. The first overtone
pulsators are placed with periods increased by 0.15 . The stars of different
crossings are mixed. The outstanding star is X Sgr but S Mus seems to be
normal in this plane. Notation of stars as in Fig. 5.
References:
Balona, L.A. 1977, M.N.R.A.S., 178, 231.
Barnes, T.G. 1980, In: Current Problems in Stellar Pulsation Instabilities,
NASA Tech. Memorandum 80625, p. 639.
Becker, S.A., Iben, I., Tuggle, R.S. 1977, Astrophys. J., 218, 212.
Cox, A.N., Hodson, S.W. 1978, I.A.U. Symposium, No. 80, p. 237.
Cox, A.N. 1978, Astrophys. J., 229, 212.
Dean, J.F., Warren, P.R., Cousins, A.W.J. 1978, M.N.R.A.S., 183, 569.
Flower, P.J. 1977, Astron. Astrophys., 54, 33.
Ivanov, G.R. 1981, Astrophys. Space Sci., 79, 107.
Johnson, H.L. 1966, Ann. Rev. Astron. Astrophys., 4, 193.
Joshi, S.C., Rautela, B.S. 1980, Astrophys. Space Sci., 70, 393.
Kraft, R.P. 1961, Astrophys. J., 134, 616.
Opolski, A. 1968, Acta Astron., 18, 515.
Pel, J.W. 1978, Astron. Astrophys., 62, 75.
Sollazzo, C., Russo, G., Onnembo, A., Caccin, B. 1981, Astron. Astrophys., 99, 66.
Sandage, A.R., Tammann, G.A. 1969, Astrophys. J., 157, 683.
Schaltenbrand, R., Tammann, G.A. 1971, Astron, Astrophys. Suppl. Ser., 4, 265.
Stobie, R.S. 1977, M.N.R.A.S., 180, 631.
Stoble,. R.S., Balona, L.A. 1979, M.N.R.A.S., 189, 641.
Szabados, L. 1977, Mitt. Sternw. ung. Akad. Wiss., Budapest, Nr. 70.CoKon 70
Szabados, L. 1980, Mitt. Sternw. ung. Akad. Wiss., Budapest, Nr. 76.CoKon 76
Thompson, R.J. 1975, M.N.R.A.S., 172, 455.
van den Bergh, S. 1977, In: Proc. I.A.U. Coll. No. 37, Decalages vers le
Rouge et Expansion de l'Univers, p. 13.
Figure 12. Luminosity - fundamental period relation. The first overtone
pulsators are placed with periods increased by 0.15 . The stars of different
crossings are mixed. The outstanding star is X Sgr but S Mus seems to be
normal in this plane. Notation of stars as in Fig. 5.
References:
Balona, L.A. 1977, M.N.R.A.S., 178, 231.
Barnes, T.G. 1980, In: Current Problems in Stellar Pulsation Instabilities,
NASA Tech. Memorandum 80625, p. 639.
Becker, S.A., Iben, I., Tuggle, R.S. 1977, Astrophys. J., 218, 212.
Cox, A.N., Hodson, S.W. 1978, I.A.U. Symposium, No. 80, p. 237.
Cox, A.N. 1978, Astrophys. J., 229, 212.
Dean, J.F., Warren, P.R., Cousins, A.W.J. 1978, M.N.R.A.S., 183, 569.
Flower, P.J. 1977, Astron. Astrophys., 54, 33.
Ivanov, G.R. 1981, Astrophys. Space Sci., 79, 107.
Johnson, H.L. 1966, Ann. Rev. Astron. Astrophys., 4, 193.
Joshi, S.C., Rautela, B.S. 1980, Astrophys. Space Sci., 70, 393.
Kraft, R.P. 1961, Astrophys. J., 134, 616.
Opolski, A. 1968, Acta Astron., 18, 515.
Pel, J.W. 1978, Astron. Astrophys., 62, 75.
Sollazzo, C., Russo, G., Onnembo, A., Caccin, B. 1981, Astron. Astrophys., 99, 66.
Sandage, A.R., Tammann, G.A. 1969, Astrophys. J., 157, 683.
Schaltenbrand, R., Tammann, G.A. 1971, Astron, Astrophys. Suppl. Ser., 4, 265.
Stobie, R.S. 1977, M.N.R.A.S., 180, 631.
Stoble,. R.S., Balona, L.A. 1979, M.N.R.A.S., 189, 641.
Szabados, L. 1977, Mitt. Sternw. ung. Akad. Wiss., Budapest, Nr. 70.CoKon 70
Szabados, L. 1980, Mitt. Sternw. ung. Akad. Wiss., Budapest, Nr. 76.CoKon 76
Thompson, R.J. 1975, M.N.R.A.S., 172, 455.
van den Bergh, S. 1977, In: Proc. I.A.U. Coll. No. 37, Decalages vers le
Rouge et Expansion de l'Univers, p. 13.